
Figure 2. Statistical parametric map of relative decrease in gray matter concentration in subgenual anterior cingulate cortex in BPD group compared to Control group.
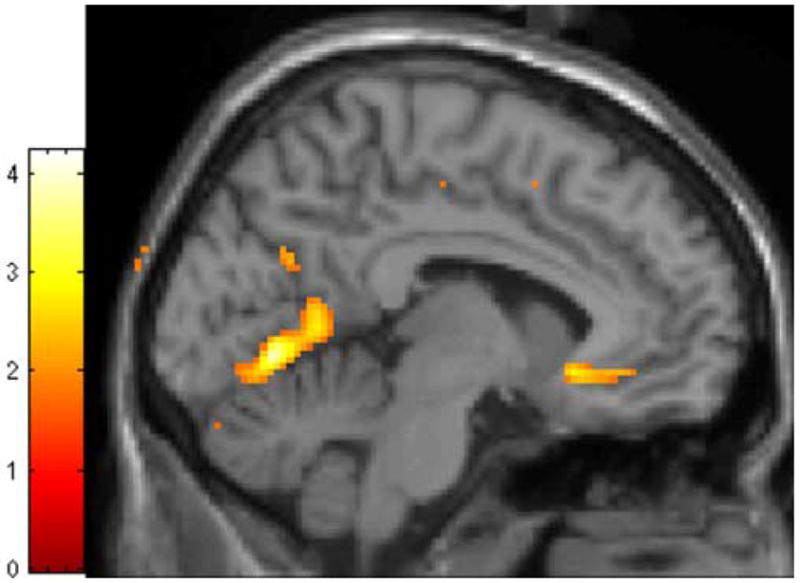
Colored area represents significant between-group differences in signal intensity of gray matter concentration (expressed as color-coded t statistic), overlaid on MNI single-subject template. Colored area in frontal cortex represents region where BPD group has significantly decreased gray matter concentration (subgenual ACC). See text for details of image analysis.