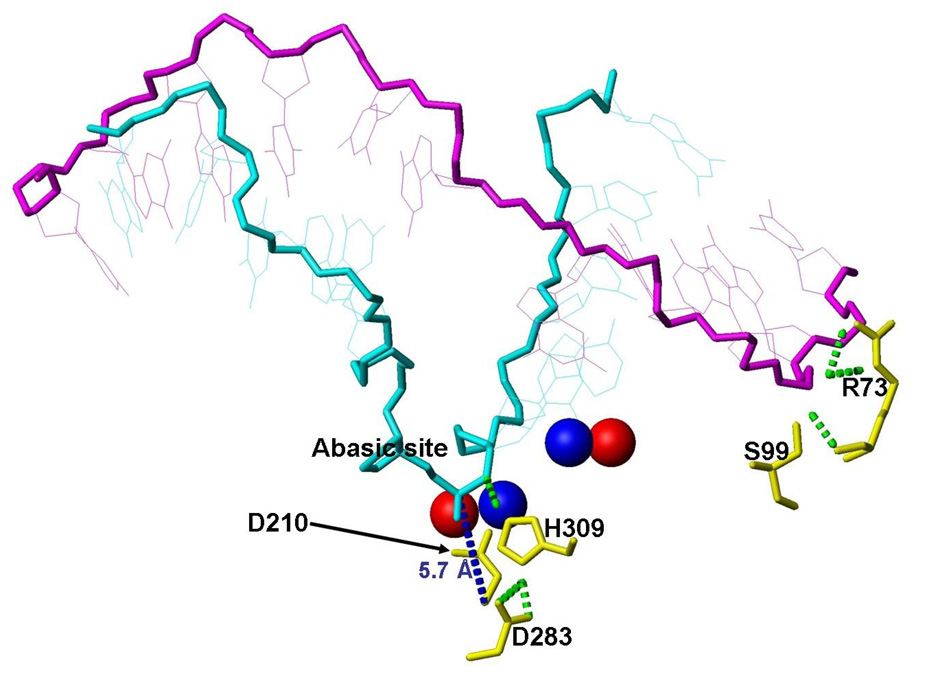
Figure 10.
Snapshots of simulation of the C99S mutant after 500 ps with two Mg2+ ions in the active site. The positions of key DNA residues and Mg2+ are shown. The final Mg2+ positions are shown in red and for comparison the starting positions, which are identical to the unperturbed pre-cleavage A- and B-site, are shown in blue. Important H-bonds are shown in dotted green lines.

