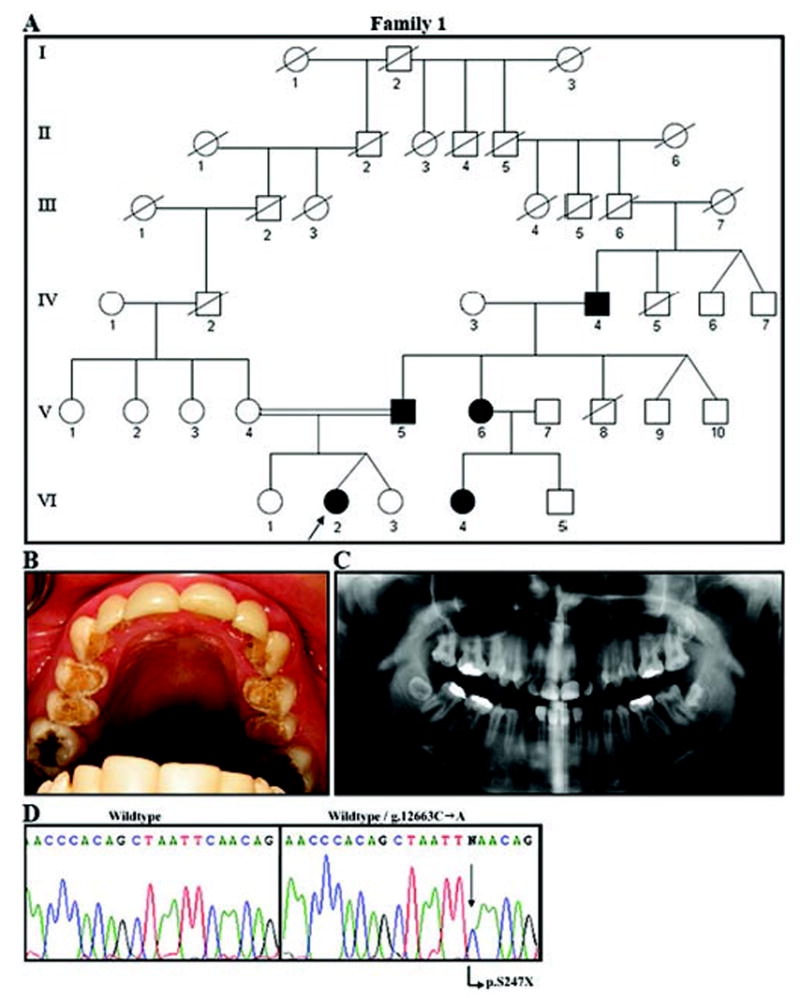
Figure 1.

Family segregating autosomal-dominant local hypoplastic amelogenesis imperfecta. (A) Pedigree of Family 1. Blackened symbols represent AI-affected individuals. No information was available on the siblings of IV-4 or on previous generations. (B) Maxillary occlusal view of the proband (VI-2). Hypoplastic enamel is evident on the occlusal and palatal surfaces of the premolars. Laminate restorations are seen on the maxillary incisors and canines. Amalgam restorations are seen on the occlusal sites of molars. (C) The panorex radiograph (from VI-2) shows local hypoplastic enamel. Decreased contrast between enamel and dentin is evident. (D) Molecular analysis of the ENAM gene in this family. The left panel shows the wild-type sequence of a portion of exon 10. On the right is the same part of exon 10 from the proband (VI-2), showing the g.12663C>A mutation (arrow) that results in a premature stop codon (p.S246X).
