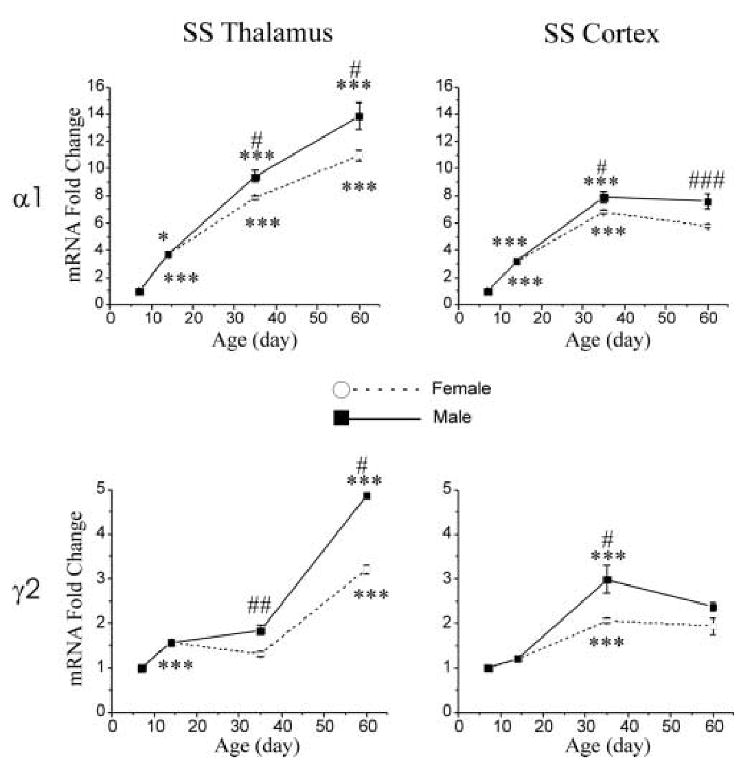
Figure 1.

Gender different postnatal developmental changes in expression of GABAA receptor α1 and γ2 subunit mRNAs in the SS thalamus (left column), and SS cortex of control (right column) male (filled square) and female (open circle) rats. The values of p14-60 mRNAs are normalized to that of p7 mRNA. Data is expressed as mean ± SEM, n=4-5. One-way ANOVA, *, p < 0.05; **, p < 0.01; ***, p < 0.001, comparison between ages p7-14, p14-35 and p35-60. T-test, #, p < 0.05; ##, p < 0.01; ###, p < 0.001, comparison between male and female rats.
