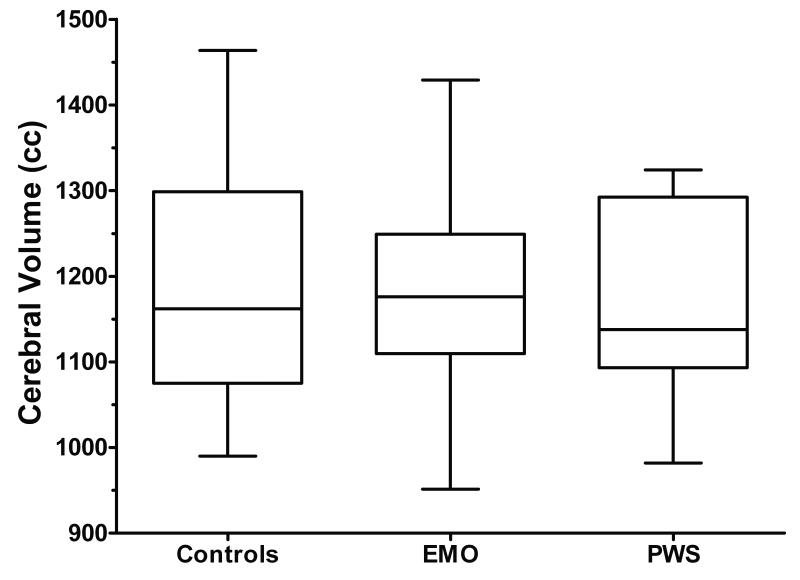
Figure 1. Cerebral volume in control siblings, EMO, and PWS.
There are no differences in overall cerebral volume between normal weight control siblings, individuals with EMO, and those with PWS.
Boxplots graph data as a box representing statistical values. The bottom of the box indicates the 25th percentile, a line within the box marks the median, the cross within the box indicates the mean, and the top of the box indicates the 75th percentile. The whiskers above and below the box indicate the 90th and 10th percentiles.

