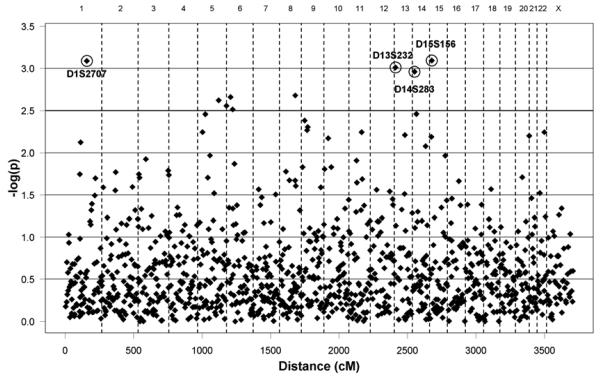
Figure 2.
Distribution of microsatellite marker LD+Linkage values of the initial genome-wide scan. Results produced by recessive Pseudomarker analysis in the extended pedigree (Set 1). The y-axis presents −log(p) values as a function of genetic distance (x-axis, in cM). Markers with −log(p)~3 are displayed.

