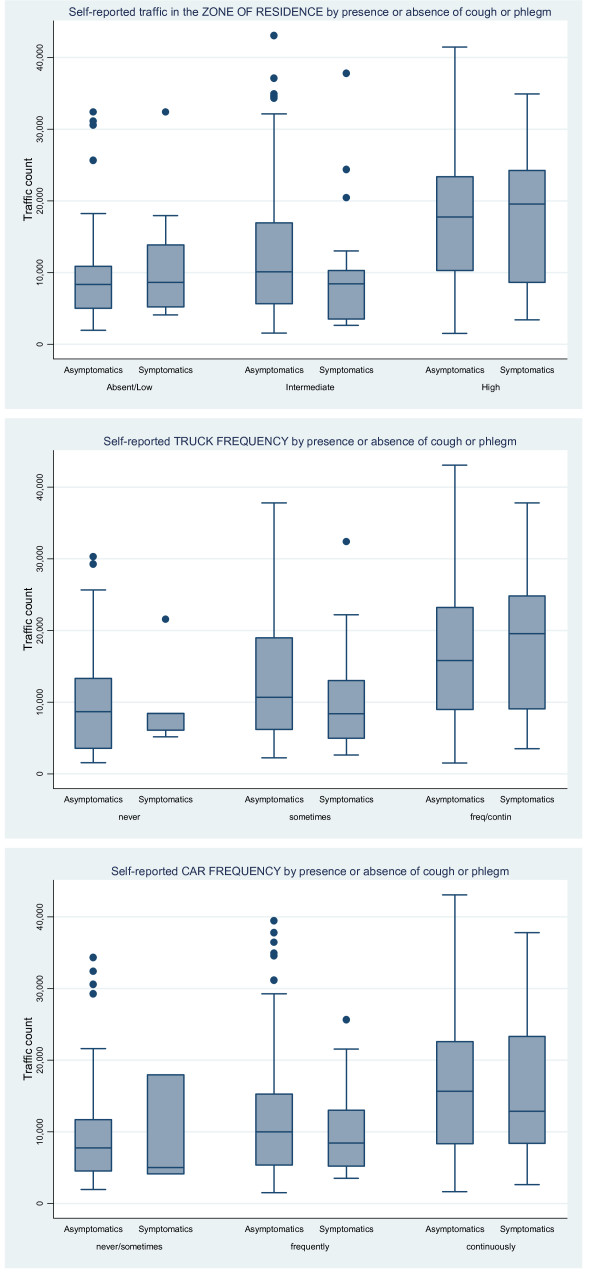
Figure 2.
Box Plot of the daily number of vehicles by categories of traffic indicators. The figure reports the daily number of vehicles by traffic in the zone of residence (upper), truck transit in the street of residence (intermediate) and car transit in the street of residence (lower), by presence or absence of symptoms of cough or phlegm. SIDRIA-2 Turin.

