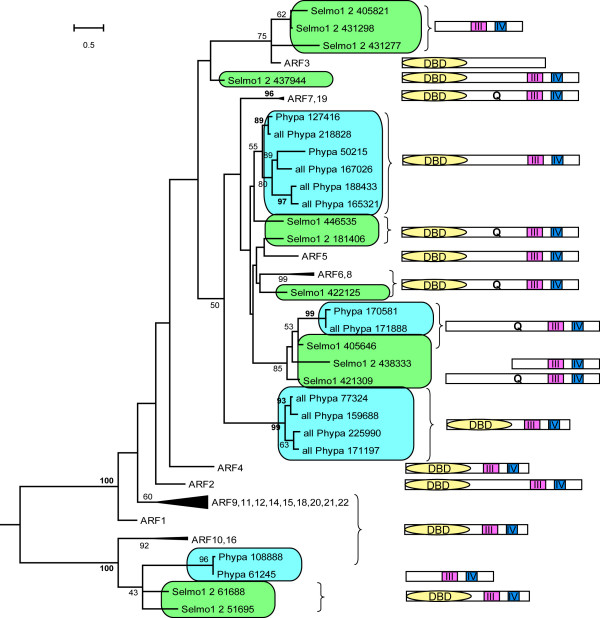
Figure 4.
Phylogenetic relationship of A. thaliana, S. moellendorffii and P. patens ARF proteins, aligned using CTDs (Maximum Likelihood (ML) method). Bootstrap values greater than 49 are recorded. These numbers are given in bold if the NJ value is equal to or higher than the ML value. This applies only to those branches common to both topologies.

