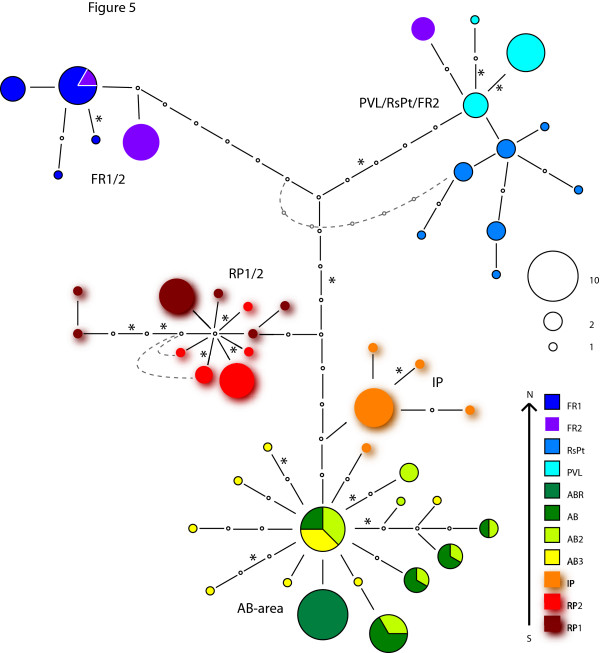
Figure 5.
CYTB haplotype network for Palos Verdes region T. californicus. Network is constructed as depicted in Figure 3. Five clusters of haplotypes that group largely by geography are labeled by sites. Dashed lines indicate alternative haplotype relationships found in statistical parsimony analyses. Haplotypes are shadowed for visual clarity.

