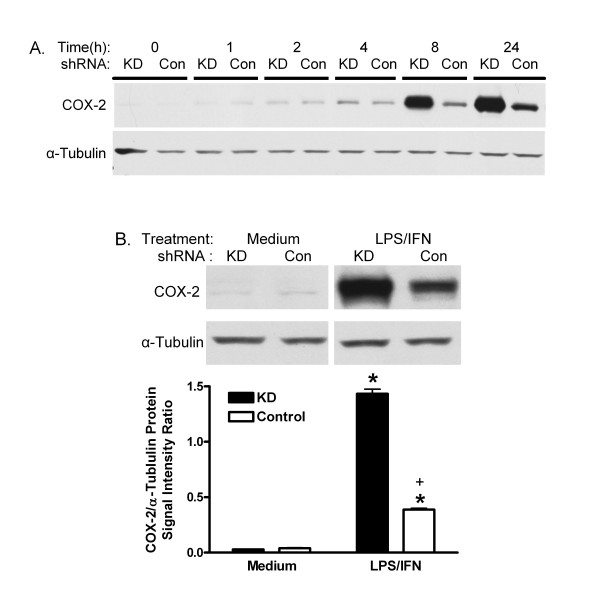
Figure 1.
Effect of PIN1 knockdown on COX-2 protein. A, KD and Control (Con) shRNA MAEC were treated with LPS and IFN for 0–24 h. B, Cells were treated with medium or LPS and IFN for 24 h. Representative western blots of COX-2 and α-tubulin are shown. Bars in B represent mean + SE ratio of COX-2/α-tubulin from densitometric analysis of 3 cultures of each group. *:p < 0.05 for comparison between medium- and LPS/IFN-treated cells, and +, p < 0.05 for comparison between KD and Control cells treated in the same manner.

