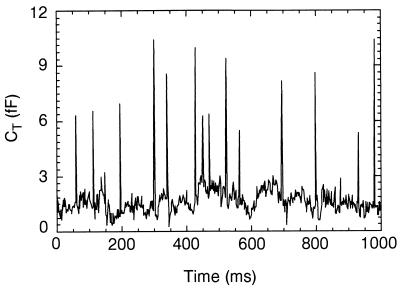
Figure 2.
Device response over a course of 1,000 ms to fixed mouse myeloma SP2/0 cells suspended in 75% ethanol/25% PBS solution at 10°C. Distinct peaks are present in the data; each peak corresponds to a single cell flowing past the electrodes. The slight difference in peak widths is an artifact of the time-resolution limit of the data acquisition. The channel height of the device was 30 μm.

