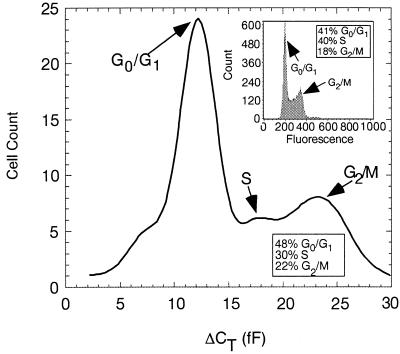
Figure 3.
Frequency histogram of the SP2/0 cells obtained with a device of h = 30 μm, as compared with that obtained by conventional laser flow cytometry. The ungated histogram shows two major peaks, one centered at 12.3 fF, corresponding to G0/G1 phase, and one centered at 23.0 fF, corresponding to G2/M phase. The distribution of cells at capacitances less than 10 fF correspond to hypodiploid cells; the distribution of cells at capacitances greater than 27 fF is due to hyperdiploid cells. Based on the histogram obtained, we judged that approximately 48% are in G0/G1 phase, 30% are in S phase, and 22% are in G2/M phase. This cell cycle distribution is comparable to that obtained by conventional flow cytometry. (Inset) Histogram obtained via conventional flow cytometry. The data have been gated and do not include hypo- and hyperdiploid cells. Two peaks at fluorescence channels 190 and 380 correspond to G0/G1 and G2/M phases, respectively.

