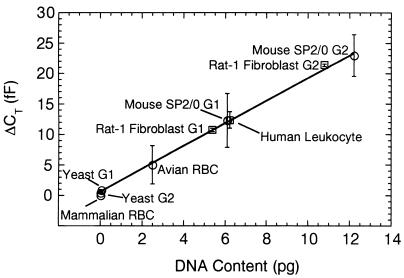
Figure 4.
Change in capacitance, ΔCT, vs. DNA content of mouse SP2/0, yeast, avian, and mammalian red blood cells. As shown, there is a linear relationship between ΔCT and DNA content at 1-kHz frequency. ○, Data taken with a device whose channel height was 30 μm; □, data taken with a device whose channel height was 40 μm. The 40-μm data were scaled by the ratio of the ΔCT values obtained for mouse SP2/0 cells measured with 30-μm- and 40-μm-high channel devices (see ** footnote). All data were obtained at T = 10°C and in PBS solution.

