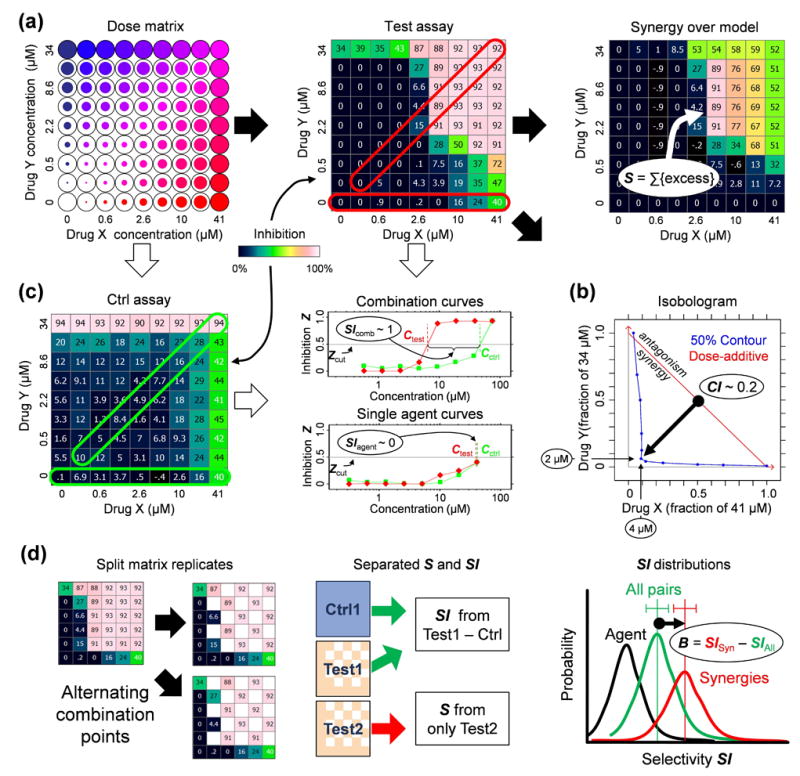
Figure 1.

Measuring the selectivity bias. (a) Determining synergy using dose matrix data. A factorial dose matrix samples all mixtures of two serially-diluted single agents’ concentrations. Phenotypic measurements, like inhibition Z relative to vehicle-treated samples, can be visualized over the matrix using a color scale, and each data point be compared to expected values via a null model (e.g., the highest-single-agent24 or dose-additive47 model, see Methods) derived from the single agent data along the left and bottom edges of the matrix. The synergy score S = ln fX ln fY Σdoses max(0,Zdata) (Zdata − Zmodel) sums up the excess inhibition over the HSA model with weights to account for drug dilution factors fX,fY, and favor synergy at high inhibition levels. (b) Synergy can also be described using an isobologram, which compares the doses along an equal-effect contour (in blue) for a chosen inhibition level Zcut (here 50%) to the contour (red) for dose-additivity. The combination index29 CI = (CX/ICX) + (CY/ICY) measures the fractional shift (black arrow) between the most potent mixture’s doses CX,CY and the single agents’ inhibitory concentrations ICX,ICY. In this example, to reach 50% inhibition, only 4 μM of Drug A and 2 μM of Drug B were required in combination, compared to >41 μM and >34 μM for the single agents. (c) Selectivity is determined from the responses in two assays (“test” and “ctrl”). Single agent (horizontal frames) and fixed dose ratio combination curves (diagonal frames) are extracted from both dose matrices. For Zcut, effective concentrations Ctest,Cctrl (top dose if agents don’t reach Zcut) are determined in both assays (colors match frames in matrices) for all extracted curves, and the selectivity index SI = log10(Cctrl/Ctest) measures potency shifts between assays, where SI = 1 implies a tenfold potency ratio favoring the test assay. The synergistic selectivity for a single combination can be described using ΔSI = SIcomb − SIagent or ΔCI = CIctrl − CItest based on the most selective diagonal curve and the most effective single agent in the test assay. (d) The selectivity bias was determined by comparing SI shifts across many combinations. To avoid spurious correlations due to noise, each test matrix was split into independent copies (see Methods), one to calculate SI and the other for S. The SI distributions across the screen were compared for all combinations (green distribution) and those with S > Scut (green), and the selectivity bias B is measured as the difference between the mean SI values for the two distributions. For reference, we also show the SI distributions of the more effective single agent in black.
