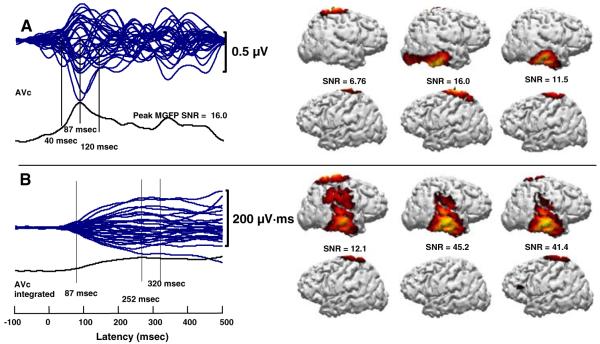
Fig. 3.
AVc “ba” a MMN time waveform butterfly plot and CDR models, and b MMNi waveform butterfly plot and associated CDR models. CDR models on the right of each panel show the left and right hemispheres at times corresponding sequentially to the vertical lines on the left of the panel. SNRs are the MGFP SNR for the particular point in time

