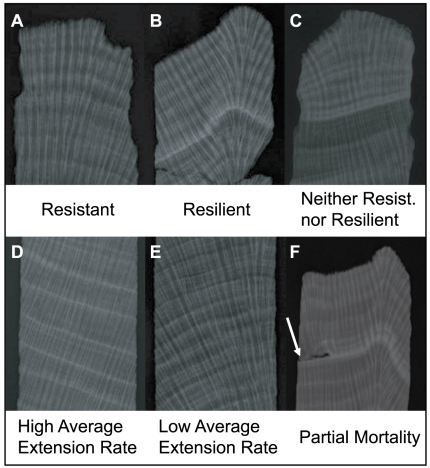
Figure 1. X-radiographs of various coral cores showing the different types of growth behavior discussed.
(A) Coral without the 1998 growth suppression, indicating resistance to bleaching in 1998. (B) Coral with the 1998 growth suppression, recognized by the bright high-density band, but with a quick return to pre-1998 extension rates, indicating resilience after bleaching. (C) Coral with the 1998 growth suppression and continuing depressed extension rates after 1998, indicating a lack of both resistance and resilience to bleaching. (D) A coral with relatively high average extension rate. (E) A coral with relatively low average extension rate. (F) A coral with a partial mortality scar on the left (noted by white arrow), coincident with the 1998 growth anomaly.

