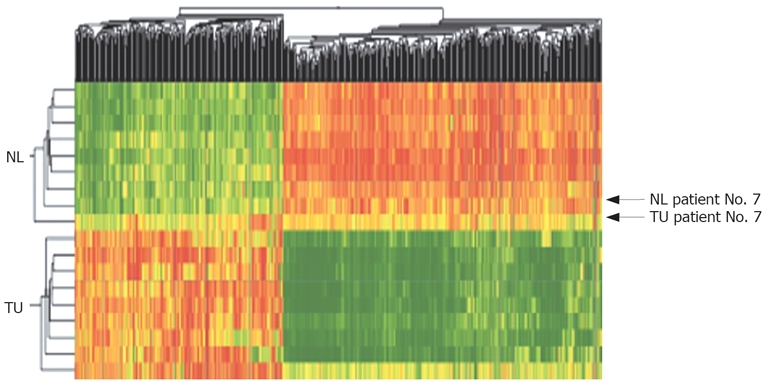
Figure 2.

Two-dimensional cluster analysis of CCC (TU) and corresponding non-malignant liver tissues (NL) using 552 dysregulated genes/ESTs (red: overexpressed genes, green: downregulated genes; Pearson’s correlation). Dysregulation was defined as different genetic expression in > 70% of all probes with a fold change > 2.0. Horizontal lines show all dysregulated genes in one singular tissue probe, vertical lines show the expression of one gene in all analyzed tumor and non-malignant tissue probes. Using cluster analysis a fast differentiation between tumor tissue and non-malignant tissue was possible in 90% of cases (tumor tissue of Patient No. 7 showed many genetic similarities to non-malignant liver tissue).
