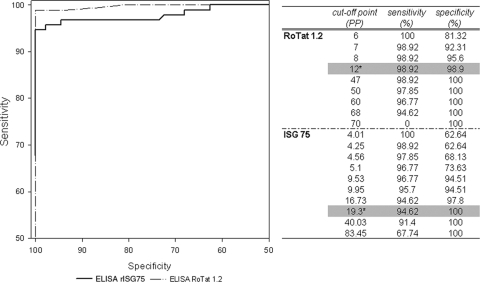
FIG. 2.
ROC curves of the ELISA/rISG75 and the ELISA/T. evansi (ELISA/RoTat 1.2) for detection of T. evansi in camels, with the TL assay as a reference test. The right panel shows combinations of sensitivity and specificity of the ELISAs at different cutoff values. The optimal combinations of sensitivity and specificity are shaded in gray. The asterisks indicate the corresponding cutoff values.

