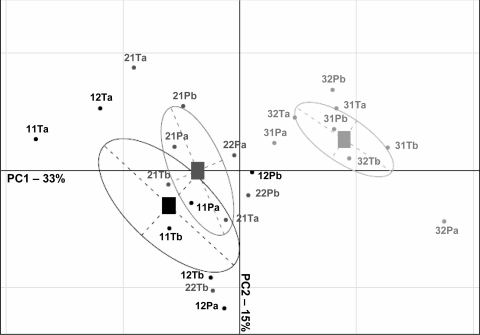
FIG. 6.
Comparison of genetic structures of fungal communities of the rhizosphere associated with inoculated and control plants by PCA, using fungal 28S rRNA profiles obtained by SSCP. For each sample, the first number represents the date of sampling (1, start; 2, middle; 3, end of the cropping season), the second number refers to the compartment (1, greenhouse 1; 2, greenhouse 2), the letters T and P are for control plants and P. oligandrum-inoculated plants, respectively, and the last letter indicates the sample.

