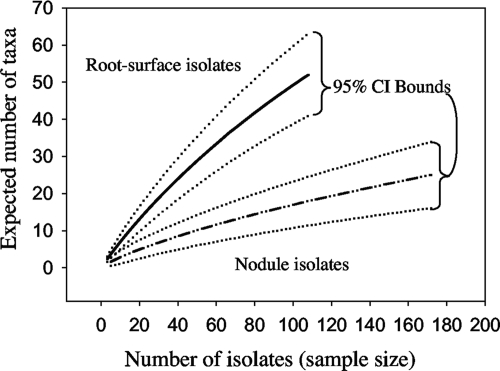
FIG. 3.
Rarefaction curves for the nodule and root surface microenvironments, with 95% confidence intervals indicated with dotted lines. Each curve describes the expected number of taxa (species richness) in a subset of n individuals drawn at random from the total pool of isolates (21). The confidence intervals of the curves do not overlap, indicating that root surfaces were significantly more diverse than nodules.

