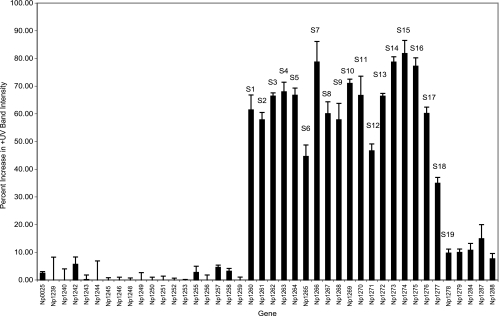
FIG. 1.
Graphical comparison of the variation in transcriptional levels of the scytonemin biosynthetic pathway, as well as surrounding ORFs in the N. punctiforme ATCC 29133 genome. This analysis shows the percent difference between the band intensity for the +UV cDNA over that of the −UV cDNA compared to that of the genomic DNA control. Each bar represents an individual gene in the pathway, and Np0025 is the control representing gyrase from N. punctiforme ATCC 29133.

