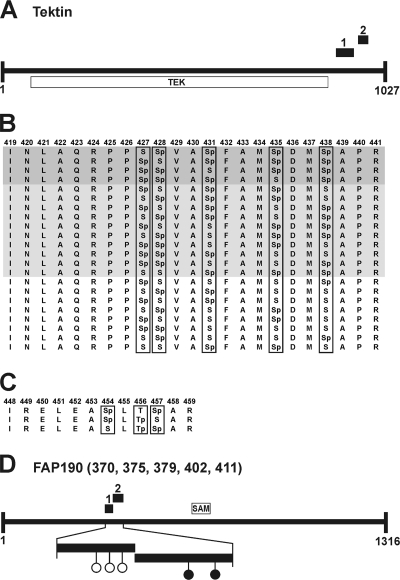
FIG. 3.
Examples of variances and clustering of phosphorylation sites. Black boxes mark identified phosphopeptides. (A) Predicted domain structure of tektin along with its tektin domain (TEK). (B) Variances of phosphorylation sites in phosphopeptide 1 of tektin. The amino acid positions are mentioned at the top. Dark and light gray backgrounds mark peptides with four and three phosphorylation sites, respectively. No background is used for the peptides with two phosphorylation sites. “p” indicates in vivo phosphorylation sites. (C) Variances of phosphorylation sites in phosphopeptide 2 of tektin. (D) Predicted structure of FAP190 along with its SAM domain. Black circles indicate nonvariable in vivo phosphorylation sites, and open circles indicate variable in vivo phosphorylation sites on Ser residues at different positions (numbers in parentheses) within the phosphopeptides.

