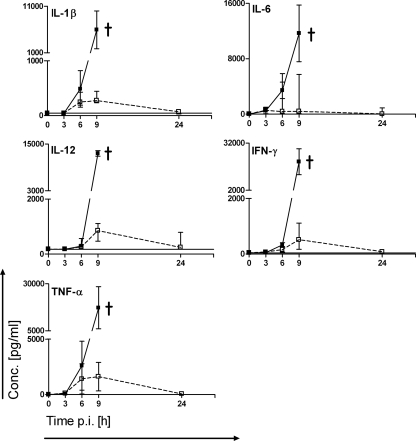
FIG. 2.
Time course of cytokine expression in serum. In each experiment mice (two animals for each time point) were infected i.p. with 106 CFU of D39Cho− (solid lines and solid squares) or D39Cho−licA64 (dashed lines and open squares). The production of IL-1β, IL-6, IL-12(p70), TNF-α, and IFN-γ was monitored over time. The median plus range from three independent experiments is shown. †, death of animals. The solid line indicates cytokine expression in naive serum. p.i., postinfection.

