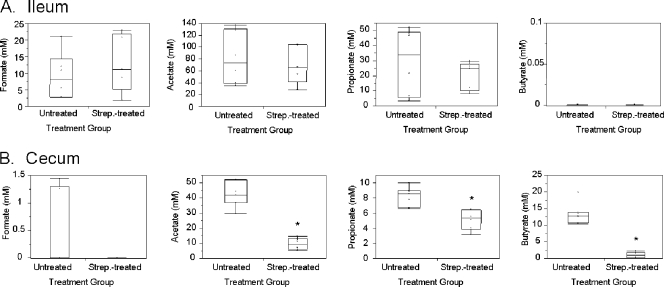
FIG. 4.
SCFAs of the untreated and streptomycin-treated ileum and cecum. Intestinal contents were collected from the ileum and cecum of both untreated and streptomycin-treated mice 72 h after treatment. SCFAs were quantified using HPLC analysis for the ileum (A) or GC-MS for the cecum (B). The box plots show the medians with 25% and 75% quartiles. The bars in each box plot extend to the outermost points located within the quartile ± 1.5× the interquartile range. An asterisk indicates a significant difference at a P value of <0.01 between the untreated mice and streptomycin-treated mice for SCFA concentrations.

