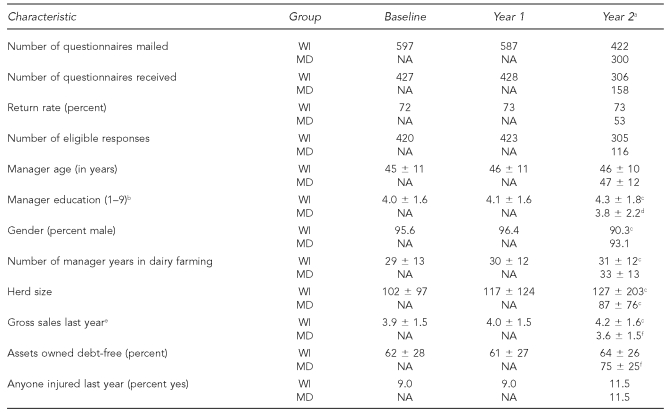
Table 1.
Wisconsin and Maryland dairy operation evaluation samples
aP-values for WI line are WI Year 0 (baseline) vs. WI Year 2. P-values for MD line are for MD Year 2 vs. WI Year 2. Calculations used Chi-square for percent and Student's t-test for numerical values.
bEducation scale: 1 = grade school, 2 = some high school, 3 = high school graduate, 4 = high school plus vocational/technical school, 5 = some college, 6 = two-year associate degree, 7 = four-year college degree, 8 = some graduate school, 9 = graduate degree
cp≤0.05
dp≤0.01
eGross sales scale: 1 = <$5,000; 2 = $5,000–$15,000; 3 = $15,001–$25,000; 4 = $25,001–$50,000; 5 = $50,001–$100,000; 6 = $100,001–$200,000; 7 = $200,001–$400,000; 8 = >$400,000
fp≤0.001
WI = Wisconsin
MD = Maryland
NA = not available because a Maryland sample was not evaluated at baseline or after the first intervention year

