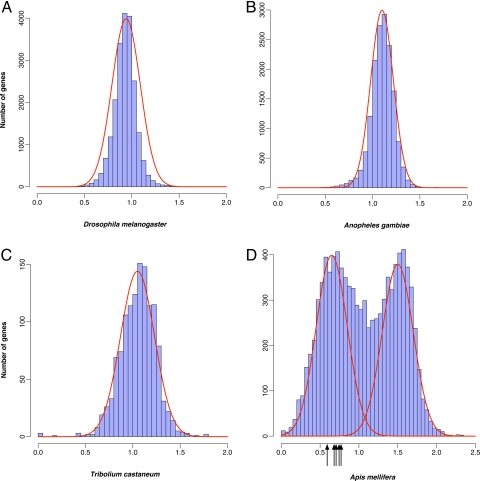
Fig. 1.
Contrasting patterns of DNA methylation in A. mellifera genes and those of other insects, as measured by CpGO/E. The y-axis depicts the number of genes with the specific CpGO/E values given on the x-axis. The distribution of CpGO/E in D. melanogaster (A), A. gambiae (B), and T. castaneum genes (C) all show unimodal distribution, reflecting a relative lack of DNA methylation in these species. In contrast, the distribution of CpGO/E in A. mellifera genes (D) is bimodal, likely demonstrating the effects of DNA methylation of CpG dinucleotides (see text). The arrows show the position of the 5 genes [GB16767 (CpGO/E = 0.56), GB19399 (0.66), GB18099 (0.67), GB12504 (0.75), and XP_001121083 (0.71)] found to be methylated in a previous study (6). Note that we could not map the gene GB15223 using our experimental procedure.

