Figure 1.
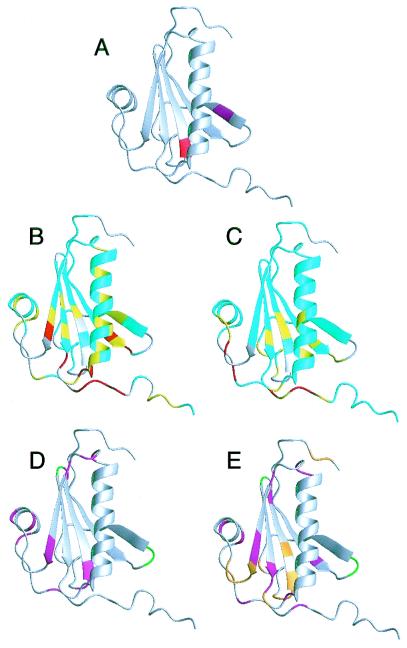
(A) Structure of gelsolin D2 excised from the crystal structure of whole equine gelsolin (11). The secondary elements are a five-stranded β-sheet (strand 1, residues 161–166; strand 2, residues 171–176; strand 3, residues 187–193; strand 4, residues 196–201; strand 5, residues 230–235) and 2 α-helices (helix 1, residues 206–223; helix 2, residues 241–247). The mutation site, Asp-187 (red), is at the N-terminal end of β-strand 3, and the masked cleavage site, Arg-172–Ala-173 (magenta), is in β-strand 2. In full-length gelsolin, β-strand 2 forms additional sheet structure with 2 strands from domain 1 and is not exposed. (B) HSQC chemical shift differences are mapped onto the crystal structure of gelsolin D2. The differences are calculated as: Diff = |(δN-WT - δN-D187N)|/7 + |(δH-WT − δH-D187N)|. If the residue is a glycine, the difference between the 15N chemical shifts is divided by 5. Differences are 0–0.1 (cyan), 0.1–0.2 (yellow), and >0.2 (red). Prolines and exchange-broadened residues are gray. (C) The Cα chemical shift differences are displayed. The differences are 0–0.2 (cyan), 0.2–0.4 (yellow), and >0.4 (red). Cαs that could not be assigned are gray. The results from the relaxation experiments are displayed for WT (D) and D187N (E). Residues that had high or low Jeff(0) values indicative of exchange or increased mobility, respectively, are colored magenta. Also, those residues that are exchanged broadened in the HSQC spectra are colored green (in WT and D187N) or orange (in D187N only). Figs. 1, 3, and 4 were produced by using the program molmol (41).

