Abstract
A continuous-flow cavity ring-down spectroscopy (CRDS) system integrating a chromatographic separation technique, a catalytic combustor, and an isotopic 13C/12C optical analyzer is described for the isotopic analysis of a mixture of organic compounds. A demonstration of its potential is made for the geochemically important class of short-chain hydrocarbons. The system proved to be linear over a 3-fold injection volume dynamic range with an average precision of 0.95‰ and 0.67‰ for ethane and propane, respectively. The calibrated accuracy for methane, ethane, and propane is within 3‰ of the values determined using isotope ratio mass spectrometry (IRMS), which is the current method of choice for compound-specific isotope analysis. With anticipated improvements, the low-cost, portable, and easy-to-use CRDS-based instrumental setup is poised to evolve into a credible challenge to the high-cost and complex IRMS-based technique.
Keywords: cavity ring-down spectroscopy, combustion, isotopic ratio
It is often taught in beginning chemistry classes that the atoms of an element all have the same chemistry. In one sense this statement is true in that all the atoms of a given element have the same valency, that is, make the same combinations with the atoms of other elements in forming compounds. In another sense, this statement is false in that different isotopes of an element have differing reaction rates leading to each compound possessing a different isotopic fractionation depending on its history of formation and transport. Consequently, high-precision isotope ratios have a special place in chemistry, especially in geochemistry, for determining reaction mechanisms and providing formation histories (1). Currently, the most commonly used instruments for determining high-precision isotope ratios are special-purpose isotope-ratio mass spectrometers (IRMS) (2, 3) that are fairly costly, require experts to operate and maintain, and are not portable—facts that have limited significantly the applicability of light stable isotope ratio measurements despite the technological advances achieved with online sample introduction and combustion for compound-specific isotope analysis (CSIA) (4).
Recently, optical spectroscopy-based instruments for measuring light stable isotope ratios have been developed that use the shift in the rovibrational absorption peaks that result from the different masses of the isotopomers (5, 6). The isotopes most commonly measured spectroscopically are 12C and 13C in carbon dioxide; however, it should be noted that the isotopes of hydrogen, nitrogen, oxygen, and sulfur have also been measured using optical spectroscopy techniques (5, 7). A salient advantage of using spectroscopy over IRMS is the ability to differentiate among isobars that are otherwise indistinguishable with mass spectrometry, caused by their identical m/z values. An example is the challenging measurement of the 34S/32S isotope ratio in SO2, using IRMS owing to the overlap in the masses of 34S16O16O and 32S18O16O; however, these isotopomers can be readily distinguished using optical spectroscopy (7). Similar isobaric interferences are also encountered with doubly substituted isotopomer studies, which proved to be very difficult to measure with IRMS (8) but can be analyzed spectroscopically.
We present a spectroscopic approach for making high-precision CSIA measurements of the 13C/12C isotope ratio of organic compounds, which is less expensive, does not require trained personnel, and is portable. The technique relies on the chromatographic separation of a mixture into individual organic compounds, the combustion of each organic compound into carbon dioxide, water, and other oxidation products, and the precise measurement of the 13C/12C isotope ratio in the carbon dioxide gas, using the absorption method of cavity ring-down spectroscopy. More specifically, each carbon atom in the compound of interest is converted to carbon dioxide, which allows the 13C/12C isotope ratio to be determined from the simple and well established infrared spectrum of carbon dioxide, using CRDS.
Short-chain hydrocarbons are used as our test compounds owing to their mud logging diagnostic significance (9) in exploratory and routine oil drilling and the suitability of our present instrumental setup for such a field measurement application. Although the 13C/12C isotope ratio could be directly measured in principle for small molecules, such as methane, this isotopic ratio becomes much more problematic to find from the parent hydrocarbon when it contains more than one type of carbon atom in the compound. This is another compelling reason why combustion followed by the spectroscopic determination of the 13C/12C isotope ratio in carbon dioxide makes this procedure so powerful and nearly universal.
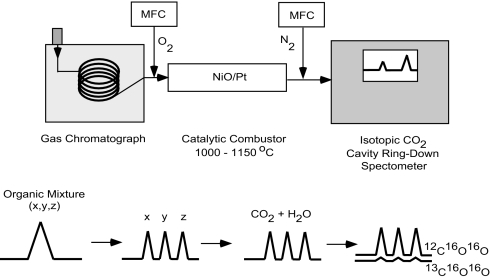
Fig. 1 shows a schematic diagram of the apparatus we have used in our first studies of this new method. A gas mixture is injected into a gas chromatograph where it separates into its components based on retention time by differential interactions with the wall coating of the GC instrument. The effluent enters a catalytic combustor (C), containing 1 wire of platinum to every 3 wires of nickel of the same diameter, into which O2 is fed by a mass flow controller (MFC). The combustor is maintained at a temperature of 1,150 °C for which complete oxidation has been demonstrated to take place (10). The resulting combustion products are combined with dry N2 before entering a cavity ring-down spectrometer. Ring-down rates are recorded for the R (12) line of 13C16O16O and the R (36) line of 12C16O16O of the (3,00,1) – (0,00,0) combination band of carbon dioxide near 6,251 cm−1 at a fixed temperature and pressure from which the concentrations of 13C16O16O and 12C16O16O are measured and used to calculate the 13C/12C isotope ratio. We refer to this setup as GC-C-CRDS. It should be appreciated that a similar approach can be followed in which the gas chromatograph is replaced by another separation technique, such as liquid chromatography with some modifications to the interface to eliminate the interfering mobile phase. If the bulk isotope ratio rather than the compound-specific isotope ratio is desired, the separation procedure can be omitted. Conversely, if the compound of interest has >1 atom of carbon occurring in unsymmetrical positions in the compound, then spectral analysis or some chemical modifications are needed before analysis to obtain the 13C/12C site-specific isotope ratio. It is also important to realize that the same approach can be used to measure the D/H isotope ratio in water as a combustion byproduct and work is underway to measure simultaneously the D/H and the 13C/12C isotope ratios of any compound of interest.
Fig. 1.
GC-C-CRDS scheme. The sample is separated with a gas chromatograph, combusted to produce carbon dioxide, and measured using cavity ring-down spectroscopy. Mass flow controllers are used to add oxygen before the catalytic combustor and dry nitrogen before the CRDS instrument.
Cavity ring-down spectroscopy allows absorption measurements to be made on an absolute basis with a sensitivity that vastly exceeds traditional absorption measurements (11, 12). In a typical CRDS system, the optical resonator includes 2 or more mirrors in an optical cavity aligned so that incident light circulates between them. The sample of absorbing molecules is placed in the cavity for interrogation. When input light to the resonator is discontinued, the radiant energy stored in the resonator decreases over time or “rings down” in the parlance of electrical engineering. For an empty cavity, the stored energy follows an exponential decay characterized by a ring-down rate that depends on the reflectivity of the mirrors, the separation between the mirrors, and the speed of light in the resonator. If an absorbing sample is placed in the resonator, the ring-down rate decreases compared with that for the empty resonator. The corresponding absorption spectrum for the sample is obtained by plotting the reciprocal of the ring-down rate versus the wavelength of the incident light. The sensitivity gain of CRDS compared with single-pass absorption measurements comes from the much larger path length of CRDS, which is often kilometers in extent, and from the relative insensitivity of the ring-down rate to fluctuations in the intensity of the light source. Previously, carbon dioxide concentrations as low as a few parts per million have been measured (13), using CRDS and the same technique has been used to determine 13C/12C isotope ratios (13–16), for example, as a diagnostic for ulcer-forming bacteria (Helicobacter pylori) by CO2 breath analysis (13). CRDS has also been used successfully to analyze hydrogen and oxygen isotopes in water samples, introduced under either a liquid or vapor form, with isotopic measurements that parallel the high-precision yielded with dual-inlet IRMS systems (17, 18). Thus, CRDS is not intrinsically inferior to mass spectrometry for isotope ratio measurements, although the present study does not reach this precision.
Results and Discussion
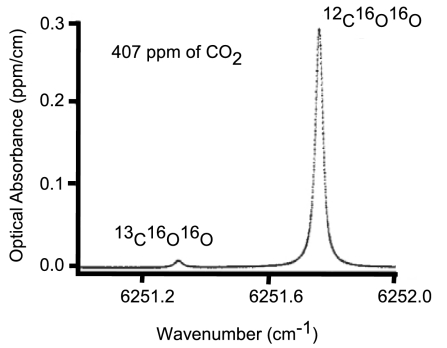
Fig. 2 presents scans of the 12C16O16O and 13C16O16O line profiles in the (3,00,1)–(0,00,0) combination band used to determine the 13C/12C isotope ratio. The cavity of the CRDS instrument is operated at 45 °C and a pressure of 140 torr (1 torr = 133.322368 pascals) consisting of the background gases helium, nitrogen, water vapor, and oxygen. The maximum amount of carbon dioxide in the cavity generated from the combustion process is typically between 0.15 and 0.70 torr. The instrument has an acquisition rate of ≈330 ring-down events per second. ≈30 and 130 ring-down traces are used for each determination of the 12C16O16O and 13C16O16O line shapes used to calculate the concentration, respectively, resulting in a repetition rate of 2 Hz. The start and end of the 12C16O16O peak are defined as the points where signal exceeded the baseline noise. The baseline noise is calculated as the average of the signal taken 2 s before the start of the chromatographic peak. The typical noise in the baseline of the 12C16O16O and 13C16O16O signals is 0.4 ppm and 0.03 ppm, respectively. The signal to noise ratio at the peak maxima generated from 5 μL of ethane, which is the minimum volume needed to produce reproducible results, is 2,600 for 12C16O16O and 400 for 13C16O16O. The signal to noise ratio for 25 μL of ethane is 14,800 for 12C16O16O and 1,500 for 13C16O16O. Volumes of >25 μL did not result in a significant improvement in the precision. Peaks are fit with an empirically transformed Gaussian function using a nonlinear least square curve fitting routine as described elsewhere (19). The repetition rate of 2 Hz limits the current setup to samples that pass through the instrument slowly relative to the few-second peak widths obtained using faster gas chromatography techniques. The current setup could be modified to operate at a faster repetition rate by using fewer ring-down events for the determination of each measurement, but this is a topic for future improvements.
Fig. 2.
Cavity ring-down line shape profiles of the R (36) line of 12C16O16O and the R(12) line of 13C16O16O for the (3,00,1)–(0,00,0) combination band of carbon dioxide near 6,251 cm−1. The traces are for carbon dioxide in the atmosphere at 45 °C and a total pressure of 140 torr.
The absolute concentrations of the individual carbon dioxide isotopomers are converted to isotope ratios, using the Boltzmann distribution at the known fixed temperature of the instrument. We have examined the possible temperature effect of the transit of the sample and carrier gas through the heated combustion chamber before their admission to the optical cavity. The combustion gases leave the furnace ≈20 °C above room temperature. The length of the tubing between the combustor and the optical cavity is ≈60 cm and we are mixing the combustion gases with dry nitrogen. We determined that there is no significant impact of the heat from the combustor on the spectroscopic analysis temperature of 45 °C, which is held at this value to a few milli-Kelvin.
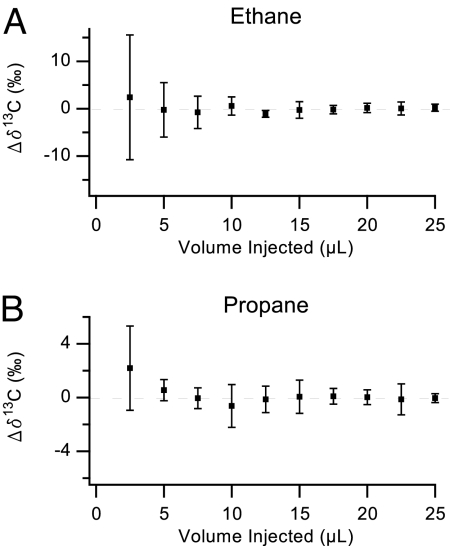
Isotope ratios are conveniently quantified in parts per mil (‰) in what is called the δ notation. Specifically, δ13C = (Rsample/Rstandard − 1) × 1,000 where Rsample is the 13C/12C isotope ratio of the sample and Rstandard is 0.0112372, which is based on the standard Vienna PeeDee Belemnite value. Thus, 1 unit of δ13C represents a change of ≈1 in the fifth decimal place of the 13C/12C isotope ratio. Rsample is calculated by dividing the integrated area of the 13C16O16O peak by the integrated area of the 12C16O16O peak from the chromatogram, in which we correct by the Boltzmann ratio of the 2 different ground-state energy levels. Fig. 3 shows the change in δ13C values for different injection amounts of ethane and propane, respectively, in the GC-C-CRDS instrument. We conclude that a volume of 5 μL or larger yields highly reproducible δ13C values of each compound. The precision of the 20 measurements with volumes of >15 μL was 0.95‰ for ethane and 0.67‰ for propane.
Fig. 3.
Measured δ13C values for ethane (A) and propane (B). The average of the measurements with volumes of 15 μL and greater is defined as zero. Error bars represent 1 SD, which have been calculated for the 5 measurements whose average is the data point shown.
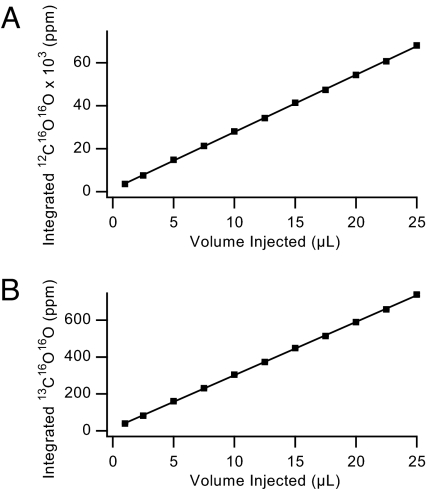
We also find that the instrument shows a high degree of linear response to increasing organic gas concentration. Fig. 4 present data for the response of 12C16O16O and 13C16O16O as a function of the injected amount of ethane. Please recall that 1 μL of ethane corresponds to ≈1 μmol of the compound.
Fig. 4.
Plot of the 12C16O16O (A) and the 13C16O16O (B) signals produced from the combustion of ethane as a function of volume injected. Each data point represents the average of 5 measurements, and the error bars (1 SD) are within the size of the marker.
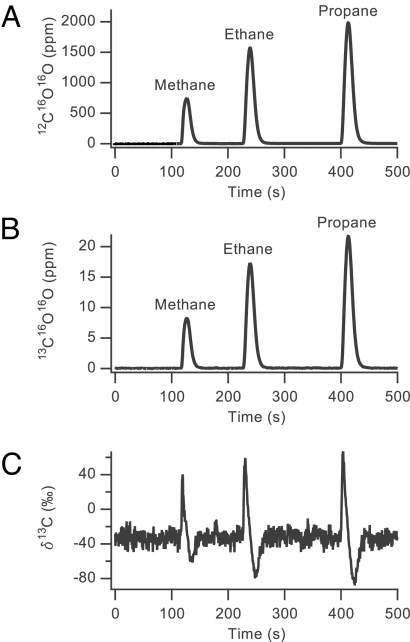
We present in Fig. 5 A and B the 12C and 13C chromatographic traces from a mixture of methane, ethane, and propane in approximately equal proportions that was injected into the GC-C-CRDS instrument. In Fig. 5C, we show the experimentally derived δ13C values. Please note the characteristic S-shape caused by what is known as the inverse isotope effect (20, 21) in which the 13C isotopomer is not as retained as the 12C isotopomer in the GC separation. This separation time shift is ∼100 ms.
Fig. 5.
Chromatographic traces of 12C16O16O (A) and 13C16O16O (B) from a 25-μL mixture of methane, ethane, and propane from which the δ13C value is calculated for each component (C). The large amount of noise in the baseline of C arises mainly from the noise in the measurement of 13C16O16O. The noise in the 13C16O16O measurement is approximately independent of its concentration within the pressure regime we operate, which leads to significant fluctuations in δ13C at baseline levels. As the sample passes through the instrument, the higher concentrations of CO2 allow for relatively more precise measurements that results in the δ13C calculation to be made with a precision of <1‰.
Table 1 shows the δ13C measured from a separation of a 75-μL mixture consisting of approximately equal amounts of methane, ethane, and propane. Table 1 also compares the δ13C values of individually analyzed gases obtained from our GC-C-CRDS instrument to those from a GC-C-IRMS instrument (University of California, Davis, Stable Isotope Facility, Davis, CA) referenced to the same Vienna PeeDee Belemnite standard. We observed systematic variations up to 5‰ in the measured isotopic ratios between the 2 techniques that is attributed to differing levels of the background gases in the CRDS cavity resulting in molecular peak broadening effects (22). The variations can be reduced in the future by modifying the peak fitting routine.
Table 1.
Comparison of δ13C values for methane, ethane, and propane run individually on the GC-C-IRMS (2.5-μL injection; split ratio 1:30) and the GC-C-CRDS (25 μL, splitless)
| Compound | GC-C-IRMS δ13C, ‰, individual components | GC-C-CRDS δ13C, ‰, individual components | GC-C-CRDS δ13C, ‰, from mixture |
|---|---|---|---|
| Methane | −44.07 ± 0.46 | −47.16 ± 0.68 | −45.76 ± 0.61 |
| Ethane | −37.68 ± 0.41 | −39.63 ± 0.89 | −36.15 ± 0.86 |
| Propane | −39.57 ± 0.20 | −39.57 ± 0.82 | −38.75 ± 1.04 |
The GC-C-CRDS individual component amounts are calibrated to have the same value for propane as for GC-C-IRMS. Also shown are the results from running a 75-μL mixture of approximately equal amounts of methane, ethane, and propane on the GC-C-CRDS. These results have not been calibrated with the measurements obtained using GC-C-IRMS. Owing to variations in the sample preparation process, differences in isotopic composition between samples run individually and as a mixture are expected. Errors represent 1 standard deviation based on 5 measurements in each case.
The variation from peak broadening was larger than expected. As a result, the amounts for methane, ethane, and propane in the GC-C-CRDS “Individual Components” column in Table 1 were decreased by 5.39‰ so the GC-C-CRDS and GC-C-IRMS values for propane are identical. This approach yields a reasonable estimate of the accuracy of δ13C for methane and ethane. The amounts in the GC-C-CRDS “From Mixture” column in Table 1 have not been adjusted from the calculated values. In the future, we plan to calibrate our samples to 2 known standards of carbon dioxide with a wide bracketing range of δ13C values in a background gas mixture similar to our experimental conditions. This procedure will allow for better calibration and for a scale multiplication factor to be applied for samples with different δ13C values (23). Previous analysis of carbon isotopes in carbon dioxide, using CRDS, did not show a significant variation from the standard for a wide range of δ13C values (13, 14), which leads us to believe that the scaling factor for the current work is likely below the measured error.
We conclude that GC-C-CRDS is able to make 13C/12C isotope ratio measurements of individual organic species with a calibrated accuracy of ≈1–3‰, which is presently inferior to GC-C-IRMS by a factor of ≈10–30, but this accuracy is sufficient in many cases of interest to make this optical technique an appealing alternative. In addition, the sample volume currently needed is ≈1,000 times greater than the amounts routinely analyzed by GC-C-IRMS. However, these results represent the first efforts, and we anticipate some hardware modifications, will lead to considerable improvements in sensitivity, precision, and accuracy.
One possible modification that could lead to a reduction in the sample volume, and an improvement in the precision and accuracy, is to switch to a wavelength in the midinfrared region. The absorption of the fundamental asymmetric vibration band of carbon dioxide at 4.3 μm is ≈105 times stronger than the combination band currently measured (24). Optical based techniques operating in the midinfrared region have produced impressive results for the isotopic measurement of carbon dioxide at atmospheric levels (25–27). However, note that the reduction in sample volume and improvement in precision may not scale directly with the increase in the strength of the absorbance caused by in part the quality of optical components currently available in the midinfrared region.
Another possible modification that can be implemented to our current system is to trap the peak of interest inside the optical cavity and perform repeated measurements over a longer time scale. This gain arises from the nondestructive nature of the CRDS measurement.
In conclusion, the GC-C-CRDS method presented here is a general approach for the determination of 13C/12C isotope ratios in any mixture of organic compounds that can be separated by gas chromatography. It is easy to imagine extending this approach to the isotope ratio measurements of the combustion product of other species, such as D/H in water or 34S/32S in SO2. As long as oxygen is used for combustion, the determination of the oxygen isotopes of the compound of interest cannot be easily accomplished. Future directions also include interfacing other separation methods, such as liquid chromatography or electrophoresis, to the combustor or chemical oxidizer before optical analysis.
Materials and Methods
A Hewlett Packard 5890 Series II gas chromatograph (Agilent) was connected to a prototype CRDS instrument through a homebuilt combustion chamber for this study. Injections of a mixture of methane, ethane, and propane (all 99.5% or higher grade purity) were separated on a GC capillary column (Agilent J&W, HP-PLOT Q, 30 m × 0.53-mm i.d., 40-μm film thickness). The helium carrier gas linear velocity (ultra-high purity 99.999%) through the column was 30 cm/s. For mixtures, the GC oven temperature program was as follows: 40 °C for 3 min, then increased at a rate of 80 °C/min to 80 °C, and held there for 4 min. For individual samples of methane, ethane, and propane the temperature was held constant at 30 °C, 40 °C, and 80 °C, respectively. The injector temperature was set to 80 °C for all of the analyses.
The output of the column was connected with a stainless steel Tee-connector (Swagelok, 1/8 inch) to a nonporous alumina tube (McMaster-Carr, 0.125-inch o.d. × 0.040-inch i.d. dual bore, 20-inch length) held in a resistively heated furnace with a feedback temperature control (Extech Instruments) operating between 1,000 °C and 1,150 °C. One platinum and 3 nickel wires (Elemental Microanalysis, 0.125 mm) were inserted into each bore of the combustion tube, and the nickel wires were initially oxidized at an elevated temperature with oxygen passing over the wires (10). Vespel ferrules (SGE, GVF8–8) were used to seal the connections between the combustion tube and the connectors. The combustion tube was positioned so the ends of the tube were at least 5 cm from the furnace to reduce heating of the fittings on the end of the tube. A flow of 1 cm3/minute of oxygen (99.6% purity) was passed through the combustion tube, via the orthogonal port of the Tee-connector, during analysis runs to ensure the availability of excess oxygen supply for the complete oxidation of the sample and to regenerate the catalyst. All gases used were supplied by Praxair.
The combustion products from the oxidation reactor were fed directly into a prototype CRDS fast analyzer (Picarro), using a stainless steel Tee-connector (Swagelok, 1/4 inch). A flow of 10–20 cm3/min of either nitrogen (99.95% purity) or ≈500 ppm carbon dioxide in nitrogen was concurrently fed into the instrument to help control the flow rate of the sample passing through the CRDS cavity.
The chromatograms from the instrument were analyzed using third party software (WaveMetrics Igor or Microsoft Excel). Details of the peak integration algorithm are discussed in Results and Discussion.
The values obtained through IRMS were referenced to a calibrated CO2 standard (Oztech Trading Corporation; δ13C = −40.86‰).
Footnotes
Conflict of interest statement: This work was funded by Picarro, Inc., and R.N.Z. is a member of the Technical Advisory Board of this company.
This article is a PNAS Direct Submission.
References
- 1.Biegeleisen J. Chemistry of Isotopes: Isotope chemistry has opened new areas of chemical physics, geochemistry, and molecular biology. Science. 1965;147:463–471. doi: 10.1126/science.147.3657.463. [DOI] [PubMed] [Google Scholar]
- 2.Becker JS. Recent developments in isotope analysis by advanced mass spectrometric techniques. J Anal At Spectrom. 2005;20:1173–1184. [Google Scholar]
- 3.Sessions AL. Isotope-ratio detection for gas chromatography. J Sep Sci. 2006;29:1946–1961. doi: 10.1002/jssc.200600002. [DOI] [PubMed] [Google Scholar]
- 4.Matthews DE, Hayes JM. Isotope-ratio-monitoring gas chromatography-mass spectrometry. Anal Chem. 1978;50:1465–1473. [Google Scholar]
- 5.Kerstel E. In: Handbook of Stable Isotope Analytical Techniques. de Groot PA, editor. Vol 1. Amsterdam: Elsevier; 2004. pp. 759–787. [Google Scholar]
- 6.Kerstel E, Gianfrani L. Advances in laser-based isotope ratio measurements: Selected applications. Appl Phys B. 2008;92:439–449. [Google Scholar]
- 7.Christensen LE, et al. Measurement of sulfur isotope compositions by tunable laser spectroscopy of SO2. Anal Chem. 2007;79:9261–9268. doi: 10.1021/ac071040p. [DOI] [PubMed] [Google Scholar]
- 8.Eiler JM. “Clumped-isotope” geochemistry—The study of naturally-occurring, multiply-substituted isotopologues. Earth Planet Sci Lett. 2007;262:309–327. [Google Scholar]
- 9.Ellis L, Brown A, Schoell M, Uchytil S. Mud gas isotope logging (MGIL) assists in oil and gas drilling operations. Oil Gas J. 2003;101:32–41. [Google Scholar]
- 10.Merritt DA, Freeman KA, Ricci MP, Studley SA, Hayes JM. Performance and optimization of a combustion interface for isotope ratio monitoring gas chromatography/mass spectrometry. Anal Chem. 1995;67:2461–2473. doi: 10.1021/ac00110a022. [DOI] [PubMed] [Google Scholar]
- 11.Busch KW, Busch MA. ACS Symp Ser 720: Cavity-Ringdown Spectroscopy: An Ultratrace-Absorption Measurement Technique. Oxford: Oxford Univ Press; 1999. [Google Scholar]
- 12.Paldus BA, Kachanov AA. An historical overview of cavity-enhanced methods. Can J Phys. 2005;83:975–999. [Google Scholar]
- 13.Crosson ER, et al. Stable Isotope Ratios Using Cavity Ring-Down Spectroscopy: Determination of 13C/12C for Carbon Dioxide in Human Breath. Anal Chem. 2002;74:2003–2007. doi: 10.1021/ac025511d. [DOI] [PubMed] [Google Scholar]
- 14.Wahl EH, et al. Applications of cavity ring-down spectroscopy to high precision isotope ratio measurement of 13C/12C in carbon dioxide. Isotopes Environ Health Stud. 2006;42:21–35. doi: 10.1080/10256010500502934. [DOI] [PubMed] [Google Scholar]
- 15.Wang C, Srivastava M, Jones BA, Reese RB. A novel multiple species ringdown spectrometer for in situ measurements of methane, carbon dioxide, and carbon isotope. Appl Phys B. 2008;92:259–270. [Google Scholar]
- 16.Wehr R, Kassi S, Romanini D, Gianfrani L. Optical feedback cavity-enhanced absorption spectroscopy for in situ measurements of the ratio 13C:12C in CO2. Appl Phys B. 2008;92:459–465. [Google Scholar]
- 17.Gupta P, Noone D, Galewsky J, Sweeney C, Vaughn BH. Demonstration of high precision continuous measurements of water vapor isotopologues in laboratory and remote field deployments using WS-CRDS technology. Rapid Commun Mass Spectrom. 2009 doi: 10.1002/rcm.4100. in press. [DOI] [PubMed] [Google Scholar]
- 18.Brand W, Geilmann H, Crosson E, Rella C. Cavity ring-down spectroscopy versus high-temperature conversion isotope ratio mass spectrometry; a case study on δ2H and δ18O of pure water samples and alcohol/water mixtures. Rapid Commun Mass Spectrom. 23:1879–1884. doi: 10.1002/rcm.4083. [DOI] [PubMed] [Google Scholar]
- 19.Li J. Development and evaluation of flexible empirical peak functions for processing chromatographic peaks. Anal Chem. 1997;69:4452–4462. doi: 10.1021/ac970481d. [DOI] [PubMed] [Google Scholar]
- 20.Wilzbach K, Riesz R. Isotope effects in gas-liquid chromatography. Science. 1957;126:748–749. doi: 10.1126/science.126.3277.748. [DOI] [PubMed] [Google Scholar]
- 21.Brand W. In: Advances in Mass Spectrometry. Hesso AE, Jalonen JE, Karjalainen EJ, Karjalainen UP, editors. Vol 14. Amsterdam: Elsevier; 1998. pp. 670–671. [Google Scholar]
- 22.Arie E, Lacome N, Arcas P, Levy A. Oxygen- and air-broadened linewidths of CO2. Appl Opt. 1986;25:2584–2591. doi: 10.1364/ao.25.002584. [DOI] [PubMed] [Google Scholar]
- 23.Coplen TB, et al. New guidelines for δ13C measurements. Anal Chem. 2006;78:2439–2441. doi: 10.1021/ac052027c. [DOI] [PubMed] [Google Scholar]
- 24.Rothman LS, et al. The HITRAN 2004 molecular spectroscopic database. J Quant Spectrosc Radiat Transfer. 2005;96:139–204. [Google Scholar]
- 25.McManus JB, Zahniser MS, Nelson DD, Williams LR, Kolb CE. Infrared laser spectrometer with balanced absorption for measurement of isotopic ratios of carbon gases. Spectrochim Acta A. 2002;58:2465–2479. doi: 10.1016/s1386-1425(02)00064-1. [DOI] [PubMed] [Google Scholar]
- 26.Schaeffer SM, Miller JB, Vaughn BH, White JWC, Bowling DR. Long-term field performance of a tunable diode laser absorption spectrometer for analysis of carbon isotopes of CO2 in forest air. Atmos Chem Phys. 2008;8:5263–5277. [Google Scholar]
- 27.Tuzson B, et al. High precision and continuous field measurements of δ13C and δ18O in carbon dioxide with a cryogen-free QCLAS. Appl Phys B. 2008;92:451–458. [Google Scholar]


