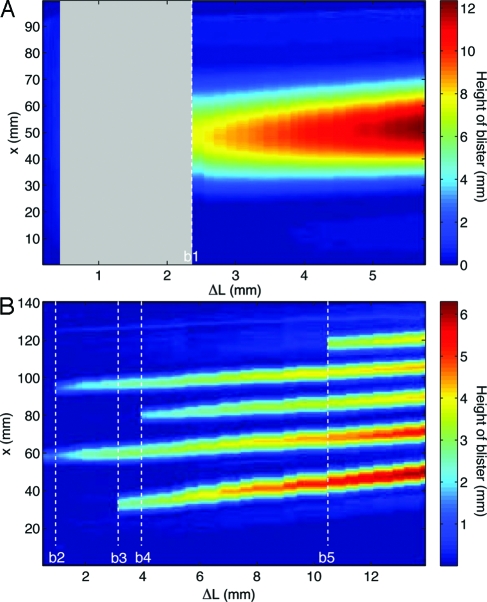
Fig. 2.
Space-compression plots. Evolution of the blister profile as the end-to-end compression is increased. Color represents the blister height profile shown in the adjacent color bars. A single blister (with h = 90 μm) (A) and appearance and evolution of multiple blisters (with h = 30 μm) (B). The gray region emphasizes the discontinuity in ΔL at the first delamination event.

