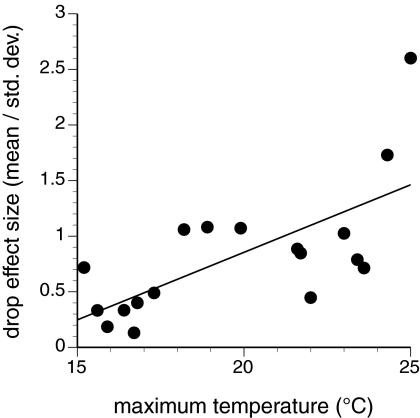
Fig. 3.
Relationship between maximum air temperature and the effect size (mean/standard deviation) of the largest drop in the upper limit over 4 weeks for all years with available data. Only days with calm seas (significant wave heights <1.0 m) were used in the determination of maximum air temperature in each year. The 2 largest effect-size values correspond to the upper limit shifts in 2004 and 1995. See text for details.

