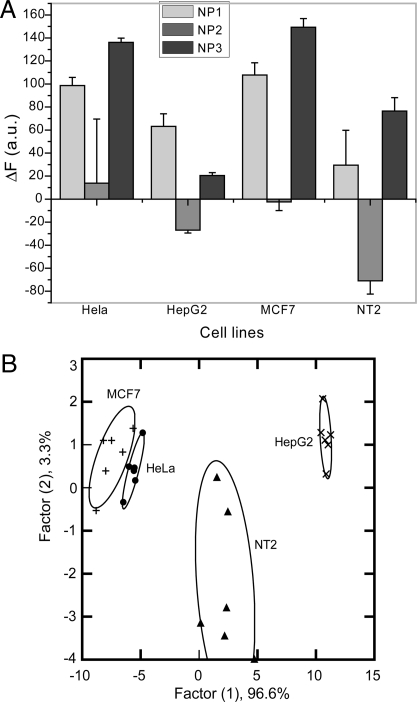
Fig. 2.
Detection of human cancerous cell lines. (A) Change in fluorescence intensities (F − F0) for 4 different cancer cell lines HeLa (Cervical), MCF7 (Breast), HepG2 (Liver) and NT2 (Testes) using nanoparticle-polymer supramolecular complexes. Each value is average of 6 parallel measurements. (B) Canonical score plot for the two factors of simplified fluorescence response patterns obtained with NP–PPECO2 assembly arrays against different mammalian cell types. The canonical scores were calculated by LDA for the identification of 4 cell lines.

