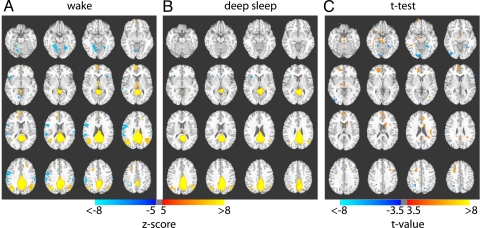
Fig. 1.
The default mode network during wake and sleep. Composite maps showing correlations with PCC during (A) wake and (B) deep sleep, and their significant difference as determined from statistical t test (C). A significant reduction of involvement of frontal regions is seen during deep sleep, whereas the posterior cingulate–inferior parietal correlations are preserved. The Z maps in A and B are both thresholded at Z = ±5.0; the t map in C is thresholded at t = ±3.5. Both positive (yellow–red) and negative (blue) correlations are shown. Z values, t values, and Talairach coordinates of all significant clusters are reported in Tables 1 and 2.

