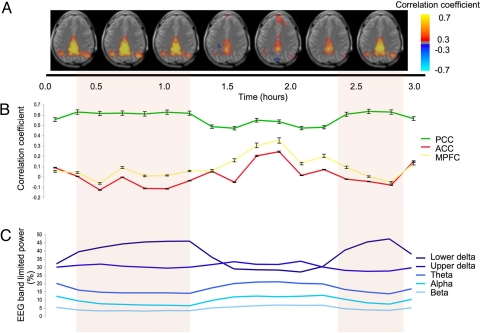
Fig. 3.
Temporal evolution of connectivity within DMN at the single-subject level. (A) Composite single-slice maps (Z = 25) of correlation with seed in PCC. Each image represents the average of 2 10-min correlation maps (for full data see Fig. S3). Periods of deep sleep (indicated by colored background) coincide with a reduced involvement of frontal regions; this is confirmed by the region-based analysis shown in B, which shows reduced correlations with ACC and MPFC in the presence of a robust correlation within PCC. Corresponding levels of band-limited EEG activity are given in C, with the following definitions: lower delta: <2 Hz; upper delta: 2–4 Hz; theta: 4–8 Hz; alpha: 8–12 Hz; and beta: 12–20 Hz).

