Figure 3.
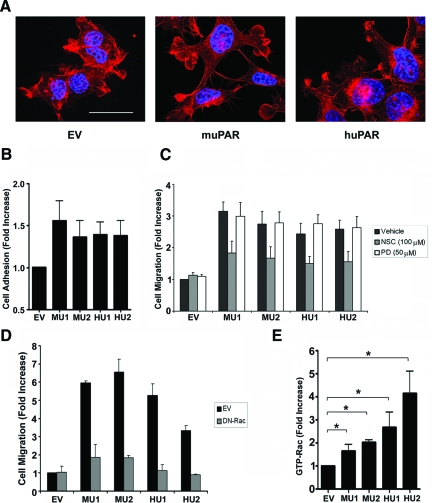
uPAR expression alters cell morphology, adhesion, and migration. A: Mouse uPAR-expressing MU1 cells, human uPAR-expressing HU2 cells, and control cells that were transfected with empty vector (EV) were stained with phalloidin (red) and DAPI (blue). Scale bar = 15 μm. B: HEK-293 cells transfected with empty vector (EV), human uPAR-expressing cells (HU1, HU2) and mouse uPAR-expressing cells (MU1, MU2) were seeded in vitronectin-coated 96-well plates. Cells were allowed to adhere for 1 hour. Cell adhesion was expressed as the fold-increase relative to EV cells (mean ± SEM, n = 4). C: EV, HU1, HU2, MU1, and MU2 cells were treated with the Rac1-GEF inhibitor, NSC23766 (NSC, 100 μmol/L), the MEK inhibitor, PD098059 (PD, 50 μmol/L), or vehicle and allowed to migrate in Transwells for 24 hours. Cell migration was expressed as the fold-increase relative to vehicle-treated EV cells (mean ± SEM, n = 4). D: EV, HU1, HU2, MU1, and MU2 cells were transiently transfected with DN-Rac1 tagged with EGFP or with empty vector (pCDNA-EGFP) as a control. Cells were allowed to migrate in Transwells for 24 hours. Cell migration was expressed as the fold-increase relative to EV cells (mean ± SEM, n = 4). E: Cells extracts were affinity-precipitated with PAK1-PBD and subjected to immunoblot analysis to determine GTP-bound Rac1. Results were standardized by separate determinations of total Rac1. Immunoblots were analyzed by densitometry. The results of four separate experiments were averaged to generate the bar graph. *P < 0.05 (mean ± SEM, n = 4).

