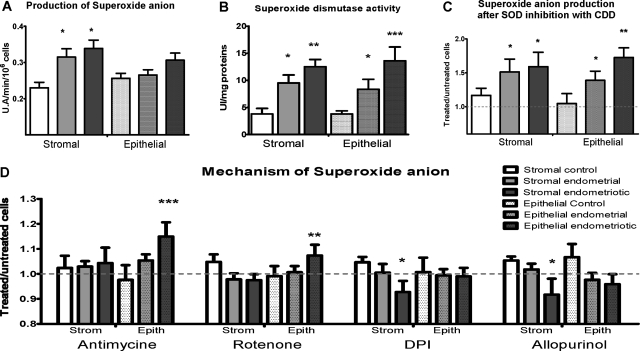
Figure 2.
Production and detoxification pathways of superoxide anion. A: Superoxide anion production. Results are expressed as arbitrary units of fluorescence for 1 minute for 106 cells. B: Superoxide dismutase activity. Results are expressed as SOD activity units/mg of proteins. C and D: Superoxide anion production was measured after treatment with diethyldithiocarbamate (inhibitor of superoxide dismutase), antimycin (inhibitor of complex III of respiratory chain), rotenone (inhibitor of complex I of respiratory chain), diphenyleneiodonium (inhibitor of NADPH oxidase), and allopurinol (inhibitor of xanthene oxidase). Results are expressed as a ratio between treated and untreated cells. Dotted line shows the level of untreated cells. Error bars represent SEM; *P < 0.05, **P < 0.01, ***P < 0.001 as compared with control cells.

