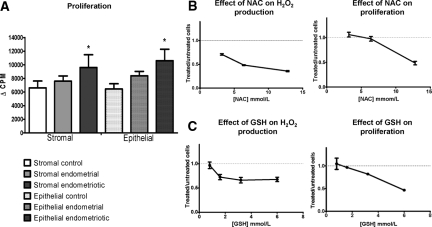
Figure 4.
A: Cell proliferation was determined by thymidine incorporation; *P < 0.05, **P < 0.01, ***P < 0.001 compared with control cells. B: Hydrogen peroxide production after treating endometriotic cells with various concentrations of N-acetylcysteine. Proliferation of endometriotic cells treated with N-acetylcysteine was measured by thymidine incorporation. Results are expressed as a ratio between treated and untreated cells. Dotted line shows the level of untreated cells. Error bars represent SEM. C: Hydrogen peroxide production after treating endometriotic cells with various concentrations of reduced GSH. Proliferation of endometriotic cells treated with GSH was measured by thymidine incorporation. Results are expressed as a ratio between treated and untreated cells. Red dotted line shows the level of untreated cells. Error bars represent SEM.

