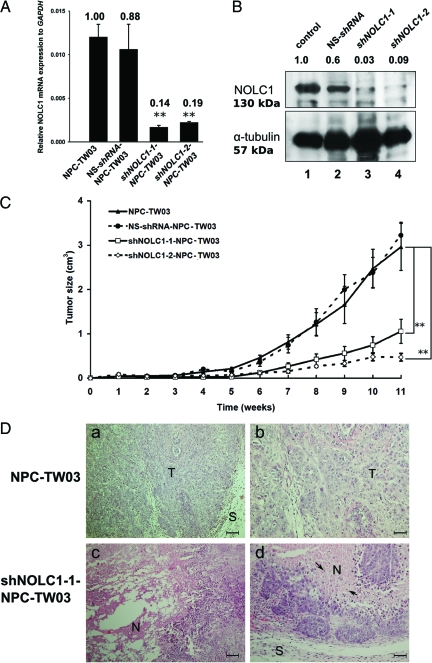
Figure 3.
Verification of two shNOLC1-transfected NPC stable lines. A: After the transfection of two NOLC1 shRNAs plasmids (shNOLC1-1 and shNOLC1-2) separately into the NPC-TW03 cell lines, the total RNAs of each line were extracted and examined by QRT-PCR analysis. The data were obtained from triplicate experiments and normalized to GAPDH expression levels. Both shNOLC1-1 and shNOLC1-2 had a clear suppressive effect on NOLC1 mRNA expression in the transfected NPC lines. Samples of mixed clone cells were measured, each point representing the mean value ± SEM (n = 3). **P < 0.01. B: Western blot analysis of NOLC1 protein expression in NOLC1-shRNA-transfected NPC-TW03 cells. Lane 1, NPC-TW03 cells without transfection (control); lanes 2–4, stable lines transfected with NS-shRNA, shNOLC1-1, or shNOLC1-2, respectively. One 130-kDa band of NOLC1 protein was visible in lanes 1 and 2. The staining intensity of the same band was very weak in lane 3 and almost invisible in lane 4. α-tubulin a 57-kDa band was used as the internal control in each lane. C: The effect of NOLC1 shRNA transfection on NPC tumor growth in vivo. severe combined immunodeficient mice bearing xenografts of NPC-TW03 cells, including NS-shRNA-, NOLC1-shRNA (shNOLC1-1 and −2)-transfected and untransfected control NPC-TW03 cells, were observed for 11 weeks, and then the tumor masses from the four groups were removed and analyzed. Each point represents the mean value ± SEM. (n = 6) **P < 0.01. D: Histological features of tumor sections from mice bearing NPC and shNOLC1-NPC xenografts. H&E staining from a paraffin section of an NPC-TW03 xenograft showed an undifferentiated carcinoma (a,b), whereas the shNOLC1-NPC xenograft sections revealed marked tumor cell necrosis (c) and apoptotic changes (d). T: tumor cells; N: necrosis; S: stroma; arrows: apoptotic cells. Scale bars = 50 μm (a and c); 100 μm (b and d).

