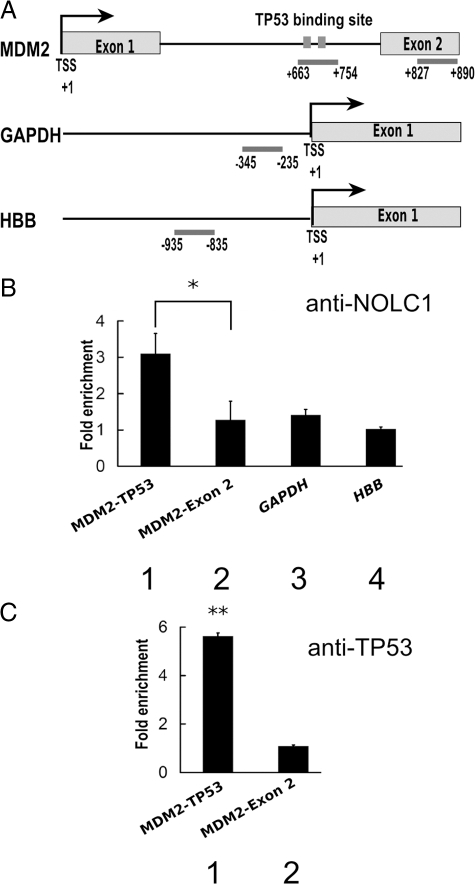
Figure 6.
Identification of the interaction region of NOLC1 in the MDM2 P2 promoter. A: Regions amplified by QRT-PCR are indicated by bars and nucleotide number relative to the transcription start site (TSS) of the internal promoter (the TP53 binding site in intron 1) of MDM2, and Exon 2 of the MDM2, GAPDH, and HBB promoter correspondingly. B: ChIP assay of the promoters by the NOLC1 antibody. QRT-PCR was used to evaluate the precipitation of the TP53 binding site and Exon 2 of the MDM2 promoter, GAPDH and the HBB promoter region from chromatin prepared from NPC-TW04 cell line chromatin using an anti-NOLC1 monoclonal antibody. Relative enrichment was calculated by comparison with the threshold cycle value for 10% of input genomic DNA and data are expressed as the fold enrichment of DNA associated with immunoprecipitated NOLC1 relative to the no-antibody control chromatin. The error bars plotted represent the mean values ± SE of triplicate measurements. C: ChIP assay by the anti-TP53 antibody as described in B. HBB: hemoglobin β. *P < 0.05, **P < 0.01.

