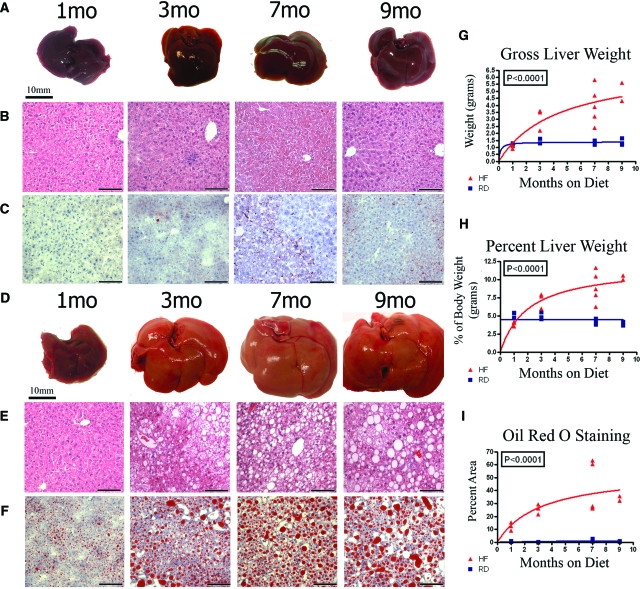
Figure 1.
Mice were maintained on a regular diet (RD: A–C) of 13.5% fat or on a high fat diet (HF: D–F) consisting of 42% fat through a time course of 1 to 9 months. Even after 9 months, gross livers from mice on the regular diet remain dark, red, free of lipid accumulation, and show little change in size over time (A). Gross liver images from mice on high fat diet show an increase in the gross size, along with yellowish appearance as a result of steatosis over time (D). The degree of hepatic steatosis increases with time in the livers of mice on high fat diet and appears as vacuolation in H&E stain (E), which is absent at all stages in mice maintained on regular diet (B). Steatosis is distinguished by ORO (C, F) staining of lipids (red droplets). The graphs respectively plot gross liver weight (G, P < 0.0001, one-way ANOVA), the percent liver weight as compared against total body weight (H; P < 0.0001, one-way ANOVA), and the percent area of ORO staining (I; P < 0.0001, one-way ANOVA) in livers of mice fed regular diet (blue box/line) and mice fed the high fat diet (red triangle/line). ORO staining in the liver increased 23-fold at 7 months on high fat diet, as compared with regular diet (P < 0.016 nonparametric Mann-Whitney). Scale bars are 10 mm for all gross liver images and 100 μm for H&E and ORO images.

