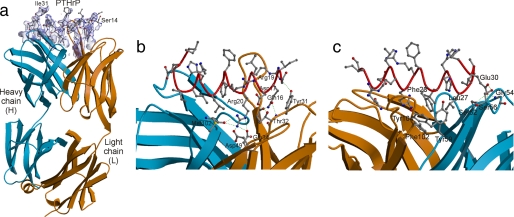
FIGURE 1.
Structure of the PTHrP-antibody complex. a, view of the final difference (Fobs − Fcalc) electron density map (blue transparent surface) in the vicinity of the hormone, at 2.0 Å resolution, calculated using protein phases derived from the final model after omitting the hormone (and surrounding atoms within 3 Å of the hormone) and performing a round of simulated annealing to remove bias. The map is contoured at 3σ with the final model overlaid upon it. b and c, view of the complex with the hormone shown in red worm (main chain) and ball-and-stick (side chain) fashion and the antibody drawn in ribbon style (the heavy chain is in blue, and light chain is in orange). b, polar interactions between the N-terminal end of the hormone with antibody. c, polar and hydrophobic interactions between the C-terminal end of the hormone with antibody. All figures were drawn using MOLSCRIPT (42) and RASTER3D (43). The electron density figure was displayed with the help of CONSCRIPT (44).

