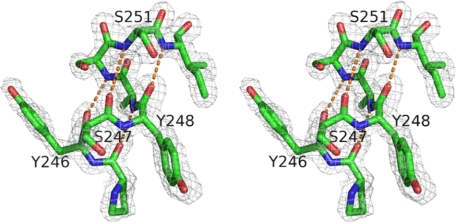
FIGURE 1.
Stereo structure of the mutation sites in B. thuringiensis Y247S/Y251S PI-PLC. Shown in the gray network is the electron density (from the simulated-annealing composite omit map and contoured at 1.2σ) for the residues in mutation sites. The helix hydrogen-bond network is shown as orange dotted lines.

