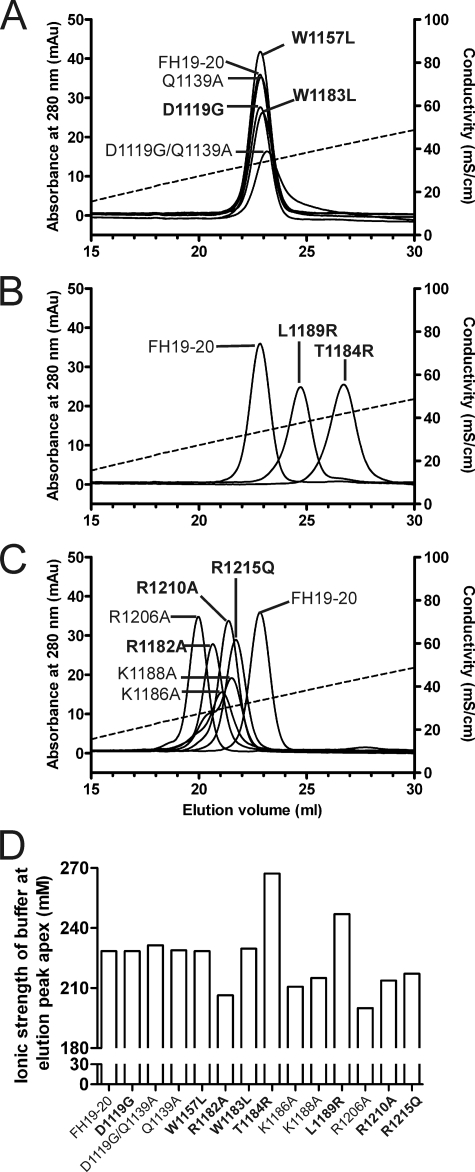
FIGURE 5.
Heparin affinity chromatography of the wild-type and mutant FH19–20 proteins. The FH19–20 wild-type and mutant proteins were applied to the heparin column in 50% PBS and eluted using linear salt gradient from 0 to 0.5 m NaCl in 50% PBS. Elution of the proteins from the column was monitored by measuring the absorbance of UV light at 280 nm. Data are shown in three panels. A, mutants that were eluted at the same ionic strength as the wild-type FH19–20; B, mutants that were eluted at a higher ionic strength than the wild-type FH19–20; and C, mutants that were eluted at the lower ionic strength than the wild-type FH19–20. Ionic strength of the buffer was followed with a conductivity meter (dashed line). D, ionic strength of the buffer at which the apex of the A280 signal peak for each protein was detected. Labels of the aHUS-associated mutations are in bold.

