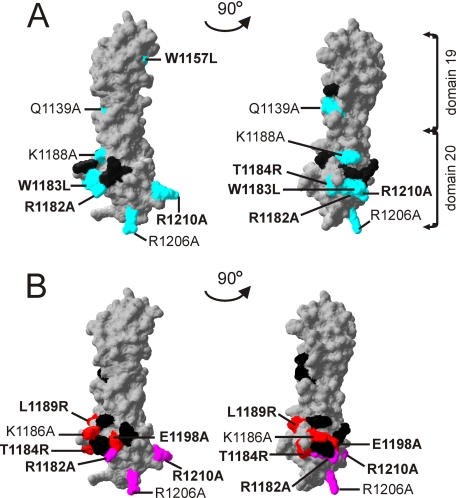
FIGURE 6.
Binding sites for C3b and mouse glomerular endothelial cells on the FH19–20 structure. A, map of the C3b binding site based on the results presented in Table 1. The indicated mutation of the light blue colored residues decreased binding to C3b, whereas the mutations of the black residues had no effect on C3b binding. B, map of the mGEnC-1 cell binding site based on the results presented in Fig. 5. The indicated mutations of the purple colored residues decreased affinity to mGEnC-1 cells, whereas the red colored increased affinity to mGEnC-1 cells. Mutations of the black residues had no effect on mGEnC-1 cell binding. Amino acids indicated in bold are associated with aHUS.

