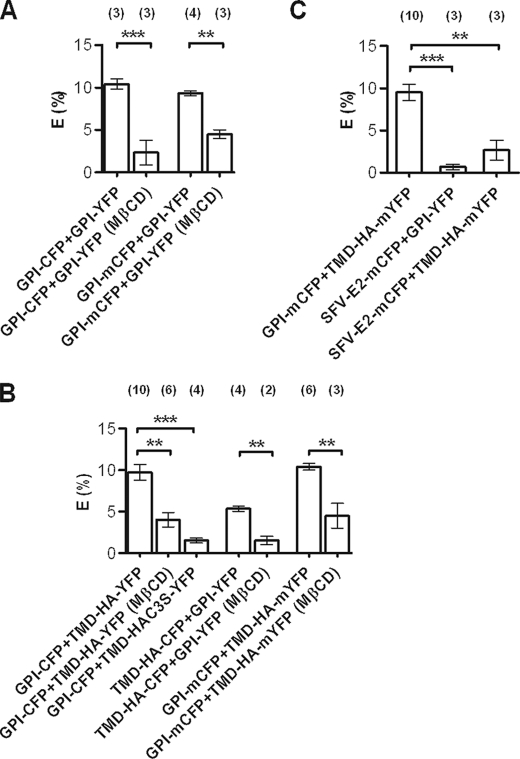
FIGURE 5.
Interaction between GPI and TMD-HA constructs measured by FLIM-FRET. FRET efficiency between raft markers (A), between raft marker and different TMD-HA variants (B), and between the non-raft marker SFV-E2-mCFP and either GPI-YFP or TMD-HA-mYFP (C). MβCD, after pretreatment with MβCD. Above the bars, n refers to the number of independent experiments is given. Each experiment is based on 10 cells. Data represent the mean ± S.E. ***, p < 0.0001; **, p < 0.005. Experiments were carried out at 25 °C.

