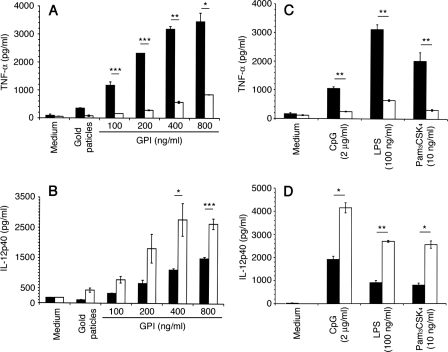
FIGURE 1.
Production of TNF-α and IL-12 by macrophages stimulated with P. falciparum GPIs. WT and MK2−/− macrophages (∼2.5 × 10⁴ cells/well) were plated in 96-well plates. After overnight culturing, the cells were stimulated with P. falciparum GPIs or with control ligands at the indicated concentrations. After 48 h, the culture supernatants were collected and assayed for TNF-α (A and C) and IL-12 (B and D) by ELISA. Black bars, WT cells; open bars, MK2−/− cells. The experiments were performed three times each in duplicate. Means values ± S.E. are plotted. *, p < 0.05; **, p < 0.01; ***, p < 0.001.

