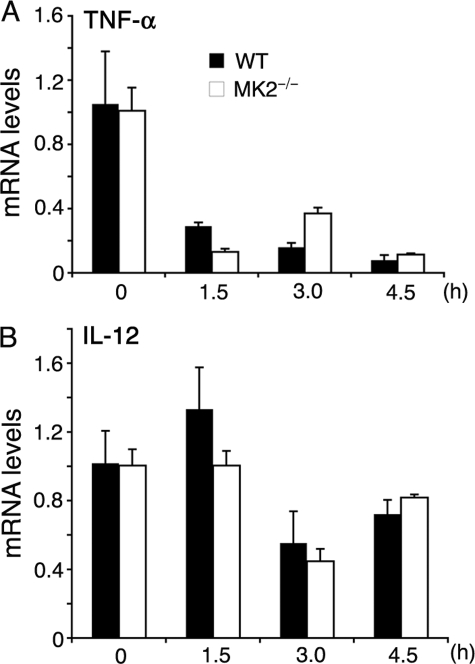
FIGURE 4.
Analysis of TNF-α and IL-12 mRNA stability in P. falciparum GPI-stimulated macrophages. WT and MK2−/− macrophages, plated in 24-well microtiter plates (∼1 × 10⁶ cells/well), were stimulated with 200 nm of P. falciparum GPIs. After 4 h, actinomycin D (10 μg/ml) was added to stop transcription. At the indicated time points after the addition of actinomycin D, cells were harvested, and total RNA was isolated. The levels of TNF-α (A) and IL-12 (B) mRNA were quantified by real time RT-PCR. The mRNA levels were normalized with respect to endogenous β-actin mRNA. The experiments were performed two times each time in triplicate. Mean values ± S.E. are plotted. The TNF-α and IL-12 mRNA stability was also analyzed by quantitative RT-PCR in WT and MK2−/− macrophages stimulated with 10 ng/ml of Pam3CSK4 (supplemental Fig. S1).

