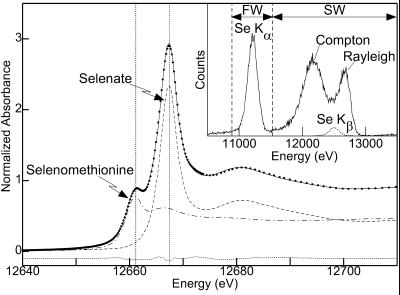
Figure 1.
Se K x-ray absorption near-edge spectrum of A. bisulcatus root tissue treated with 25 μM for 4 days (points) fit to the spectra of models. The solid line shows the best fit, which corresponds to 53% selenate, 47% selenomethionine (dashed and dot-dash lines, respectively, both scaled according to their contributions) and the dotted line shows the difference spectrum. The vertical lines show the energies of 12661.2 and 12667.5 eV, which were used for the chemically specific imaging. (Inset) Emission spectrum at 12667.5 eV for a single element of the 30-element detector for 0.2 μl of 10 mM selenate on filter paper. The fluorescence window (FW) and scatter window (SW) are indicated, together with the Compton and Rayleigh scattering and the Se fluorescence lines.

