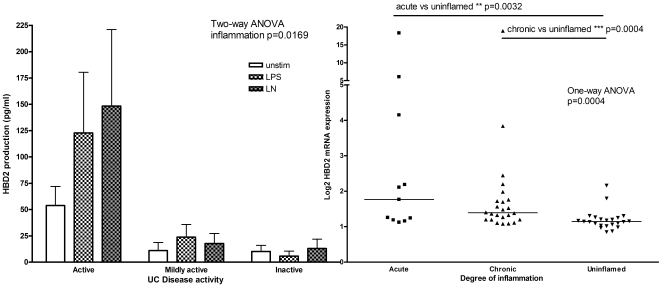
Figure 4. Increased HBD2 with inflammation in UC sigmoid colon is seen in protein (A) and mRNA (B).
(A) HBD2 protein production from UC patients according to stimulation and inflammation status. Legend is as given for figure 3. The P value from a two-way ANOVA is given. (B) HBD2 mRNA expression for UC biopsies in sigmoid colon, grouped according to inflammation status[23]. Horizontal bars denote median values. P values are from Mann-Whitney tests and the groups compared are indicated. The P value from a one-way ANOVA is also given.

