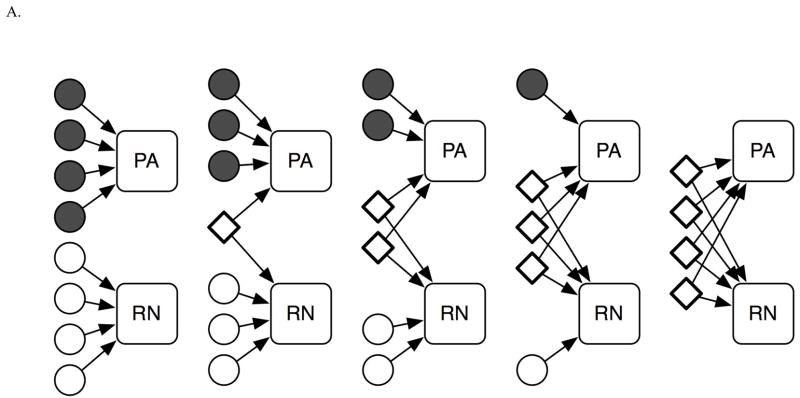
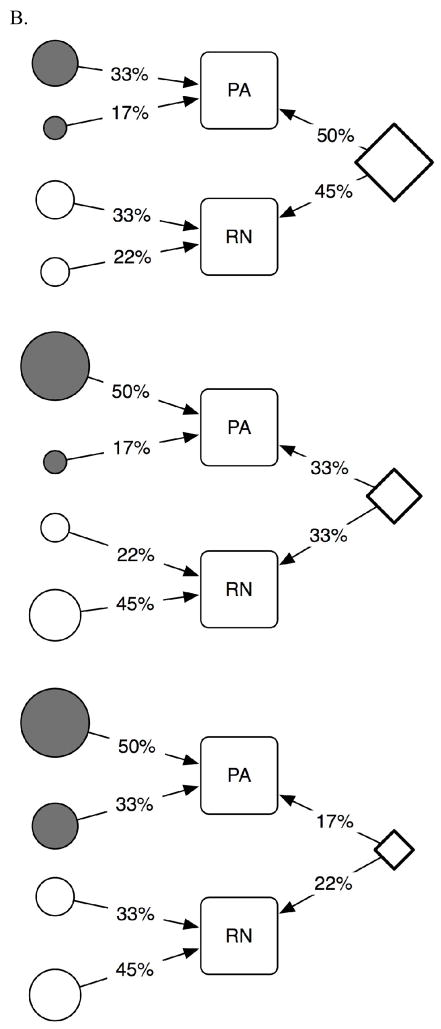
Figure 3. Diagrams of the simulation scenarios. Circles show genes contributing to the traits uniquely. Diamonds depict shared genes.
A. Simulation scenarios modeling different degrees of overlap among the genes contributing to PA and RN.
B. Simulation scenarios modeling the “detectability” of genetic effects of different magnitudes. The magnitudes of genetic effects are shown with numbers.


