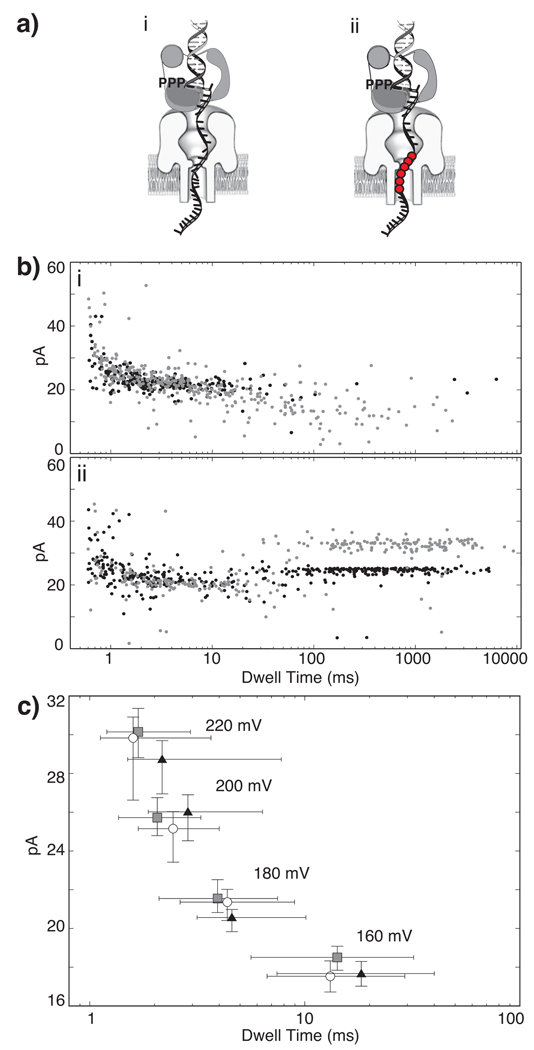
Figure 3. Characterization of molecular events that cause the two step current signature of DNA-KF complexes in the nanopore.
a) Diagram of nanopore capture of a DNA-KF-dGTP ternary complex with (i) the all DNA template, and (ii) the 6 abasic residue-containing template. Abasic residues are in template positions +12 to +17, and are shown as red circles. b) Superimposed plots showing amplitude vs. dwell time for capture events for DNA substrates with abasic-containing template (black dots) or the all DNA template (grey dots). In (i) 1 µM DNA is present but KF and dGTP are absent; in (ii) 1 µM DNA, 1 µM KF and 200 µM dGTP are present. Offline data analysis described in Methods was used to extract the EBS and terminal steps from each event in b(ii). This experiment was conducted at 180 mV applied voltage. c) Median amplitude vs. median dwell time plot for DNA alone (grey squares), or the terminal current steps of binary (white circles) or ternary complexes (black triangles) captured from the bulk phase in the cis chamber at the indicated constant voltage levels (error bars are defined by first and third quartiles). Each data point was obtained from analysis of 181 to 552 events.

